
- Ethereum broke out of a multi-month downtrend, rising from $1,600 to over $2,500 after hitting a low.
- Technical indicators RSI and MACD confirm bullish momentum, supporting a potential continuation of the upward trend.
Ethereum, the second largest cryptocurrency by market cap after Bitcoin recently defied its long-term market trend. For months, Ethereum had been following a downtrend that led to the test of the $1500 zone. However, the asset noted a breakout that has led to a parabolic surge.
Ethereum Current Market Action Explained
Tracking the current market performance for ETH as of press time, CoinMarketCap data reveals that the cryptocurrency opened its price value at $2542.76. During this session, Ethereum reported $2505 and a high of $2696 in the last 24 hours. At the moment, ETH has exceeded its daily low, trading above the $2500 zone, trying to reclaim its one-day high.
Market data indicates that Ethereum traded at $2,550.69, dropping 4.35% in the last 24 hours as of this report. Additionally, the market cap stood at $307.93 billion, reflecting the same 4.35% daily decline. Trading volume reached $24.92 billion, marking a 10.57% decrease within the same period.
The volume-to-market-cap ratio over 24 hours stood at 8.56%, indicating strong trading activity. The intraday price dropped from $2,698.80 to $2,550.69, showing steady downward movement as the price action continued consistently through the day without major recovery.
Ethereum Technical Analysis: MACD and RSI Indicators
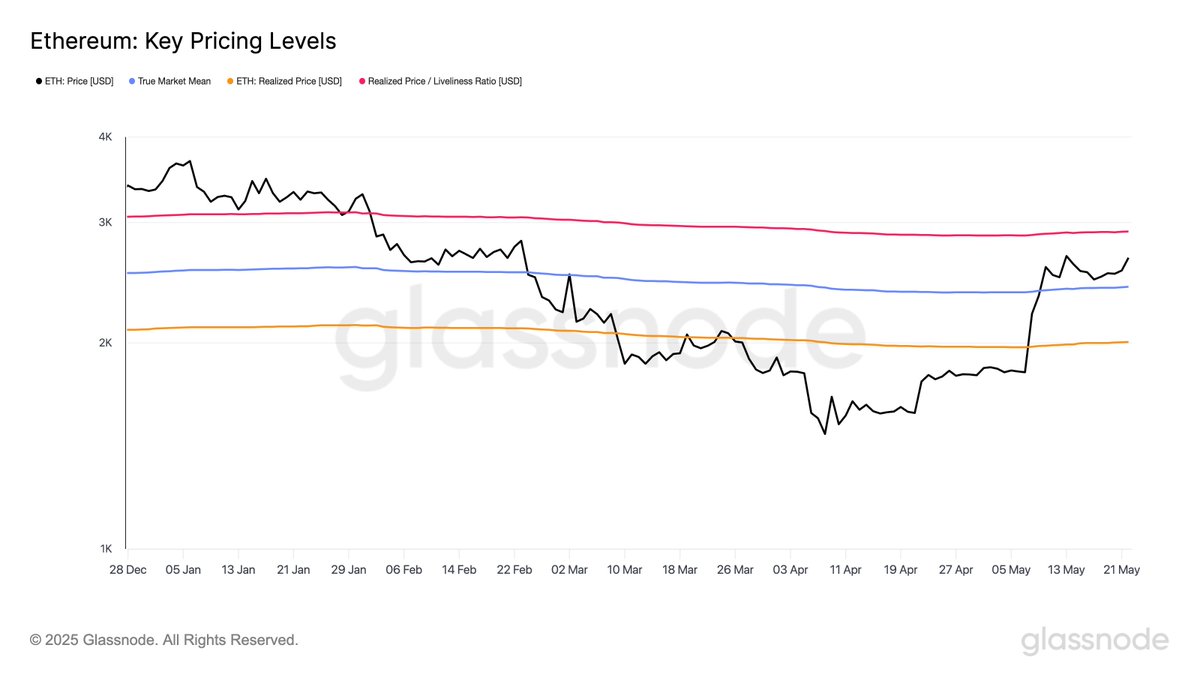
A TradingView chart from one day shows that the ETH/USD pair is moving in the favor of buyers and there are signs of the bullish turn likely lasting. During the time between late 2024 and early April 2025, ETH entered a lengthy downtrend which is clear in the descending regression channel.
This downtrend saw ETH fall from highs above $4,000 to a low near $1,600. When price broke above the channel’s upper limit in mid-April, that marked the close of the downward trend and the start of an upward move.
Source: TradingView (ETH/USD Chart)
The RSI backs up this change in trend. It started the month in oversold territory, climbed higher in May and reached over 80. The RSI is now 63.87 which is below its earlier 71.62 and means the market is cooling down slightly, but still leaning towards being bullish, above 50. The MACD (Moving Average Convergence Divergence) also confirms this reversal. The MACD line remains above the signal line, with values at 172.66 and 185.42 respectively.
Although the histogram is slightly negative at -12.76, signaling short-term consolidation, the overall trend remains positive. Together, the breakout from the descending channel, sustained RSI strength, and a still-positive MACD suggest ETH may continue to trend upward despite a slight dip.


Leave a Reply