
Pepe Coin (PEPE) price, the meme token that surged into the spotlight earlier this year, is once again testing the patience and excitement of traders. After a sharp bullish breakout, the current price action suggests a consolidation phase. But is this just a breather before another rally? Let’s break down both the hourly and daily charts to decode what’s next for PEPE.
PEPE Price Prediction: What Does the Hourly Chart Say?
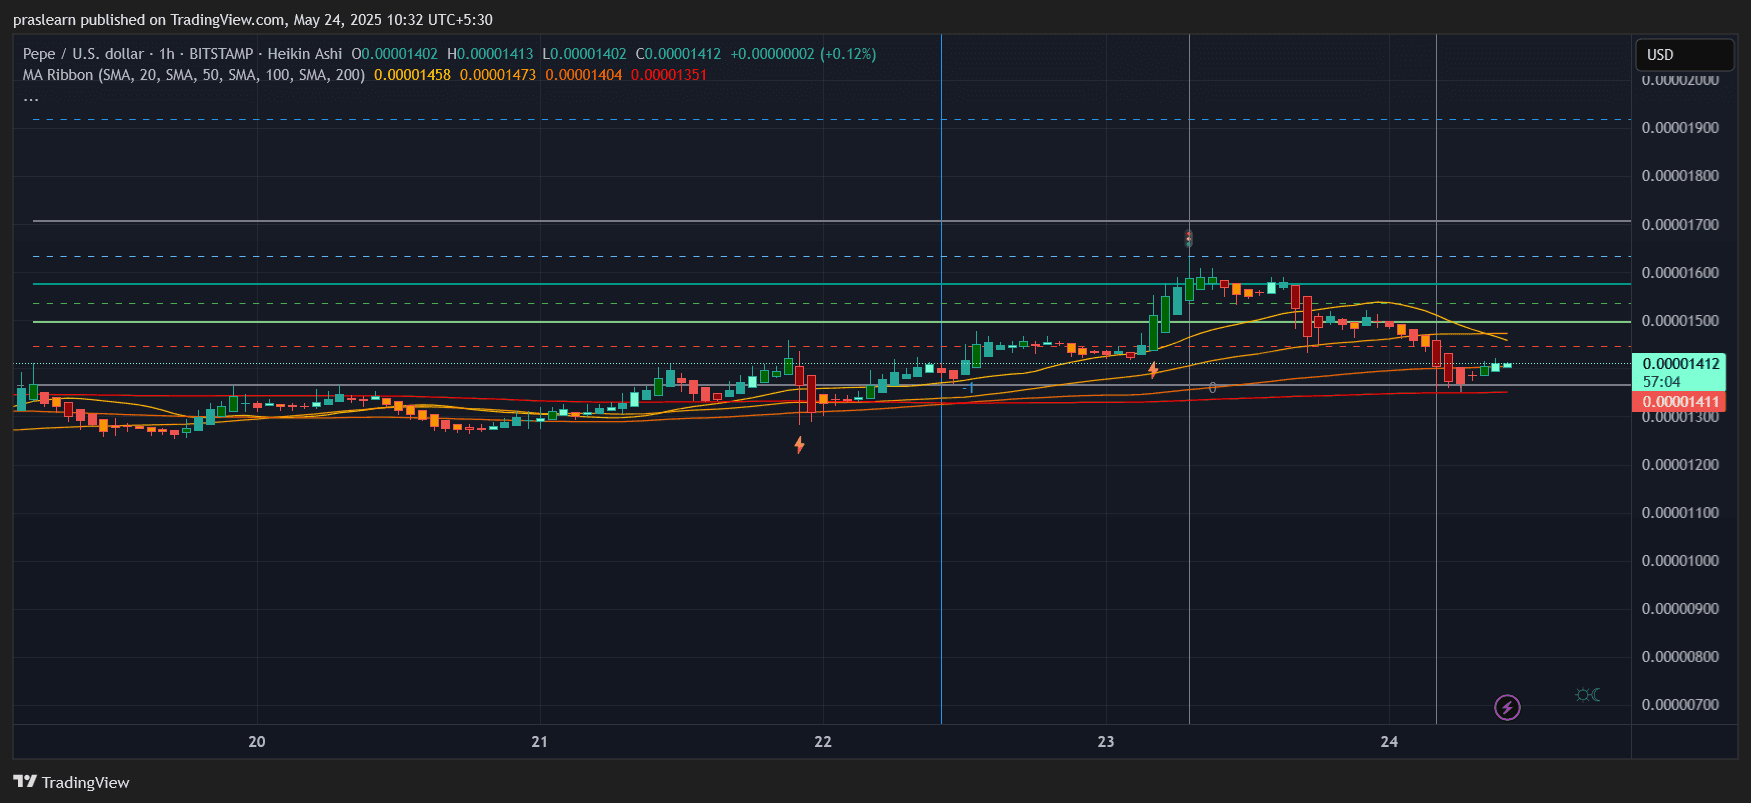
PEPE/USD 1 Hr Chart- TradingView
On the hourly chart, PEPE price is hovering around the $0.00001412 mark. After a strong run-up that took the price above $0.00001600, the coin experienced a pullback—now stabilizing just above the $0.00001400 support zone.
We notice PEPE price action closely interacting with key moving averages:
- The 200 SMA (currently near $0.00001351) is acting as dynamic support.
- The 50 SMA and 100 SMA are slightly overhead, around $0.00001404 and $0.00001473, respectively.
This alignment suggests that PEPE is still trying to reclaim short-term momentum. However, the slightly upward sloping 200 SMA hints that the broader structure remains intact unless price breaks below $0.00001350.
Importantly, the red candles followed by a small bullish bounce at the $0.00001400 level show a possible reversal zone, or at least a temporary floor for buyers to regroup.
What’s Happening on the Daily Chart?
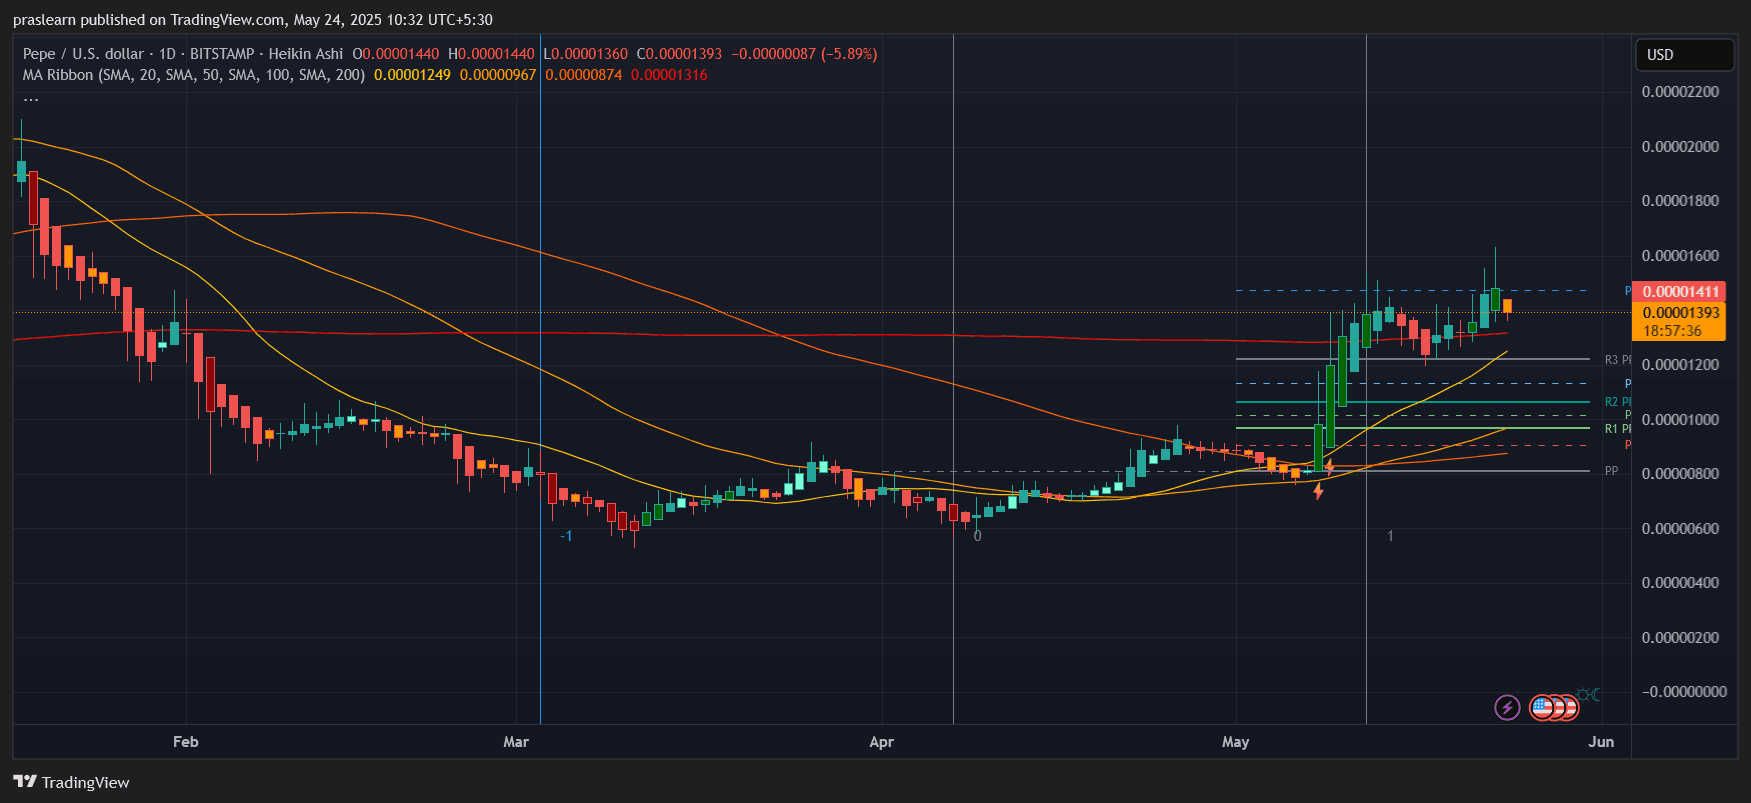
PEPE/USD Daily Chart- TradingView
Zooming out to the daily chart provides deeper context. PEPE price broke through a long-term downtrend in late April and early May, rocketing from $0.00000090 to over $0.00001600, marking a gain of more than 1666% in under a month.
Here’s a rough calculation:
(0.00001600−0.00000090/0.00000090) ×100≈1666.67%
That’s massive by any standard—and such moves are often followed by cooldowns. That’s precisely what we’re witnessing now.
Currently, PEPE price is:
- Trading near the pivot point (P) level at $0.00001411.
- Holding above the 50-day moving average (around $0.00001249), which confirms a bullish mid-term trend.
- Well above its 100 and 200 SMAs, which are still catching up after months of bearish pressure earlier this year.
This creates a bullish alignment, where price leads the moving averages in a rally, then consolidates to let the averages catch up—a healthy sign in a breakout market.
Support and Resistance Levels to Watch
From the chart structure and MA ribbon:
- Support is seen at $0.00001350 (hourly 200 SMA), and a stronger base at $0.00001249 (daily 50 SMA).
- Immediate resistance lies at $0.00001473 and then at the psychological zone around $0.00001600.
- Breaking above $0.00001600 with volume would likely re-ignite the bullish sentiment and set sights on $0.00001800 to $0.00002000.
PEPE Price Prediction: Will PEPE Go Up Again?
The setup is leaning bullish, but PEPE price needs to confirm a breakout above $0.00001473 and reclaim the $0.00001500-$0.00001600 zone to resume its upward push.
If the price holds above the $0.00001350 support and buyers step in, a surge to retest the recent high is likely. Using Fibonacci extensions from the last swing low to high, a move toward $0.00001820 is a possible near-term upside target if momentum returns.
However, failure to hold $0.00001350 could lead to a quick drop to $0.00001200, the next major demand zone.
Final Thoughts
PEPE price is currently in a textbook consolidation phase after an explosive move. It’s trading above all key daily moving averages, and hourly support at $0.00001400 is holding well.
If bulls defend $0.00001350 and flip $0.00001473 into support, PEPE could target $0.00001800 in the next leg up.
But if support breaks, expect a short-term correction before the next big move. Traders should watch volume and moving average crossovers to confirm any breakout.
Verdict: Accumulation phase likely—watch for breakout above $0.00001500 for next bullish wave.


Leave a Reply