
After a volatile retreat from recent highs, the Ethereum price today is holding near $2,543, attempting to stabilize above the crucial $2,500 handle. The short-term structure remains fragile, but multiple indicators show a potential base forming after the sharp rejection below $2,700. The broader market sentiment has turned cautious, yet Ethereum’s technical posture suggests that bulls are not ready to surrender control.
ETHUSD price analysis (Source: TradingView)
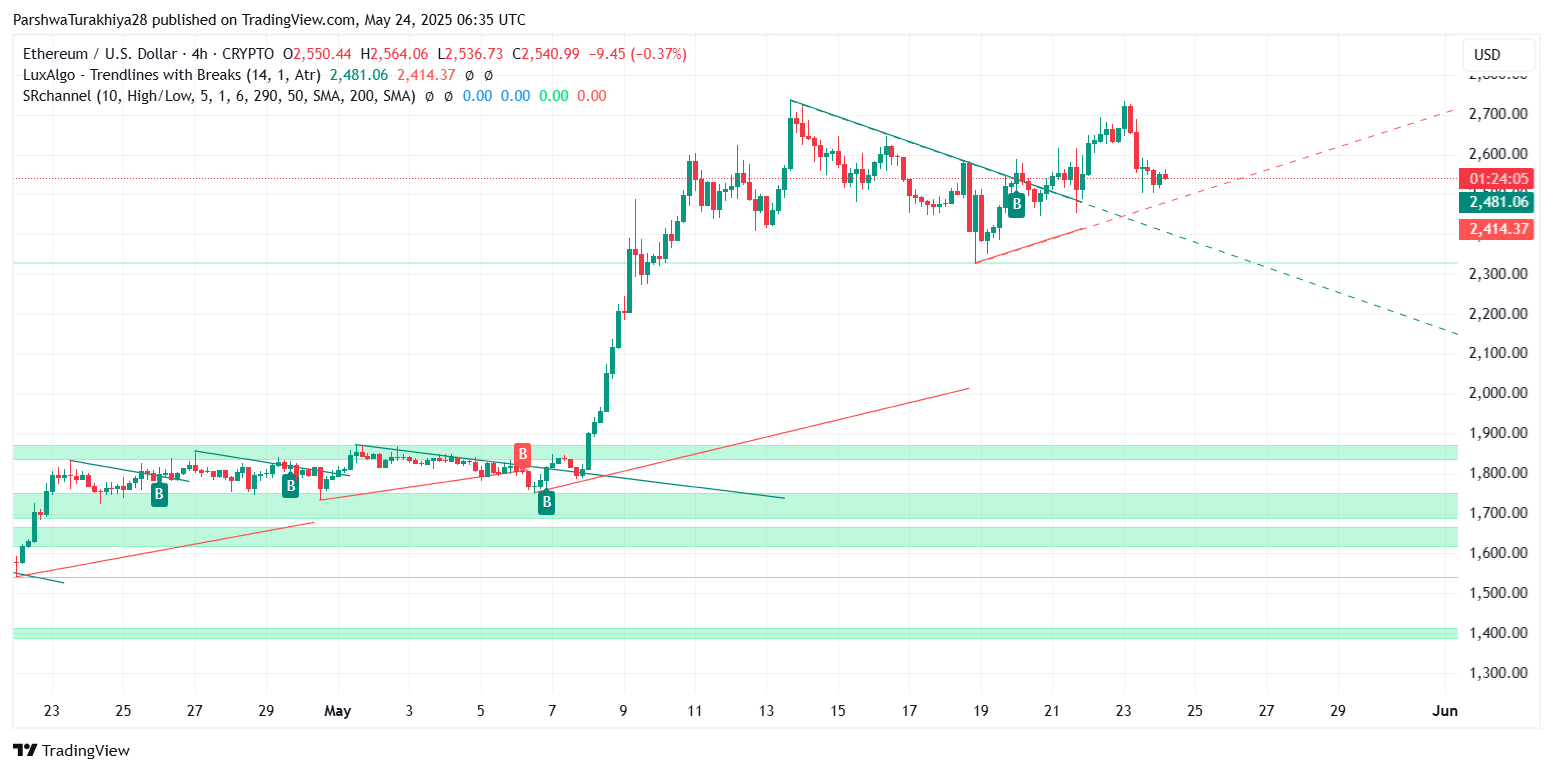
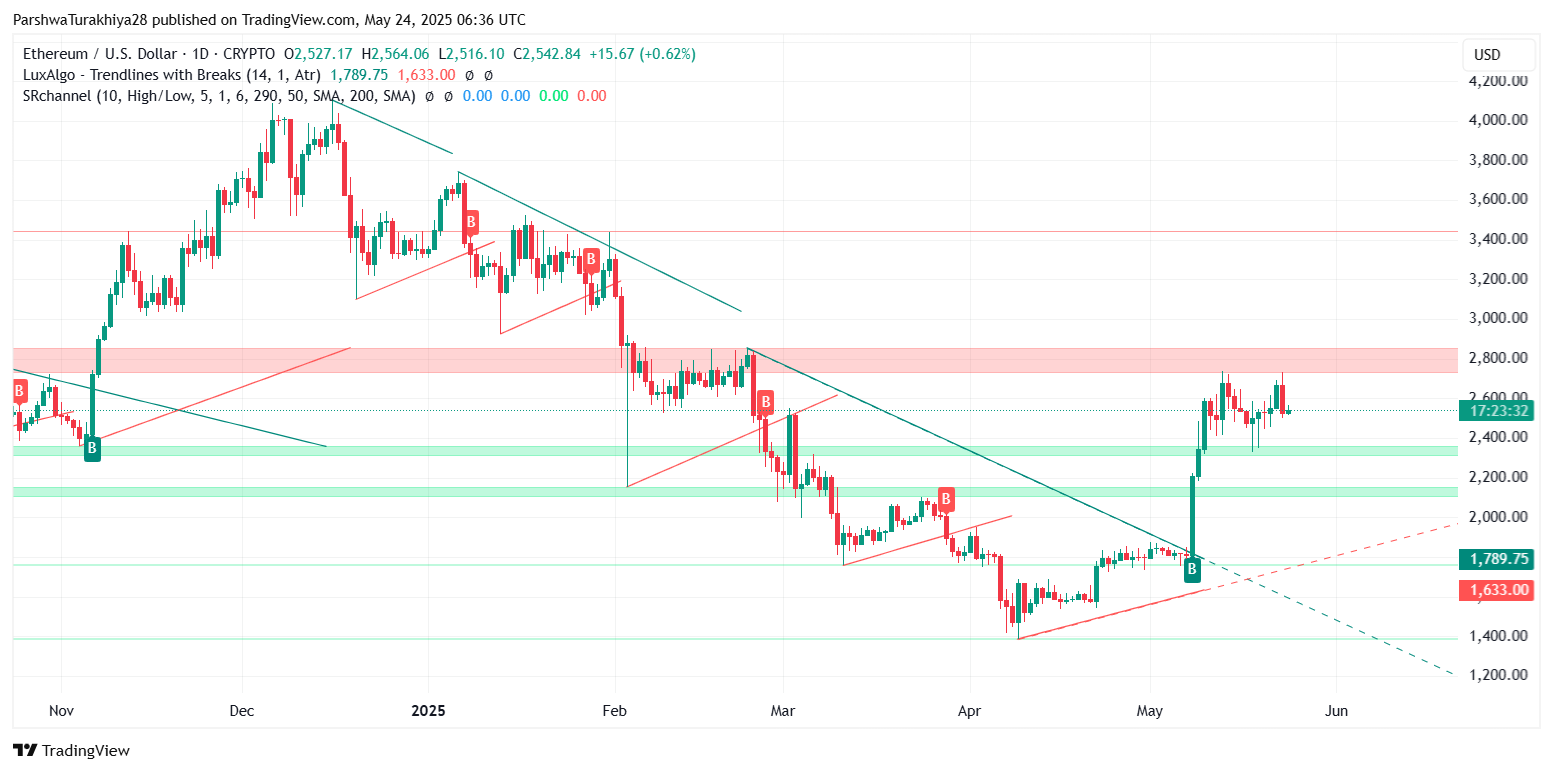
Despite recent selling pressure, the Ethereum price continues to trade within a larger ascending structure that originated earlier this month. The consolidation appears to be a healthy correction for now, provided the $2,500–$2,504 range continues to act as support. The next 24 hours will be pivotal in confirming whether ETH can sustain this floor or risks deeper retracement.
What’s Happening With Ethereum’s Price?
ETHUSD price analysis (Source: TradingView)
Ethereum’s price structure has entered a sideways consolidation following last week’s steep rally toward $2,730. On the 4-hour chart, ETH is testing the ascending trendline from May 7 while staying just above the 50-EMA ($2,539) and 100-EMA ($2,477), signaling short-term indecision.
ETHUSD price analysis (Source: TradingView)
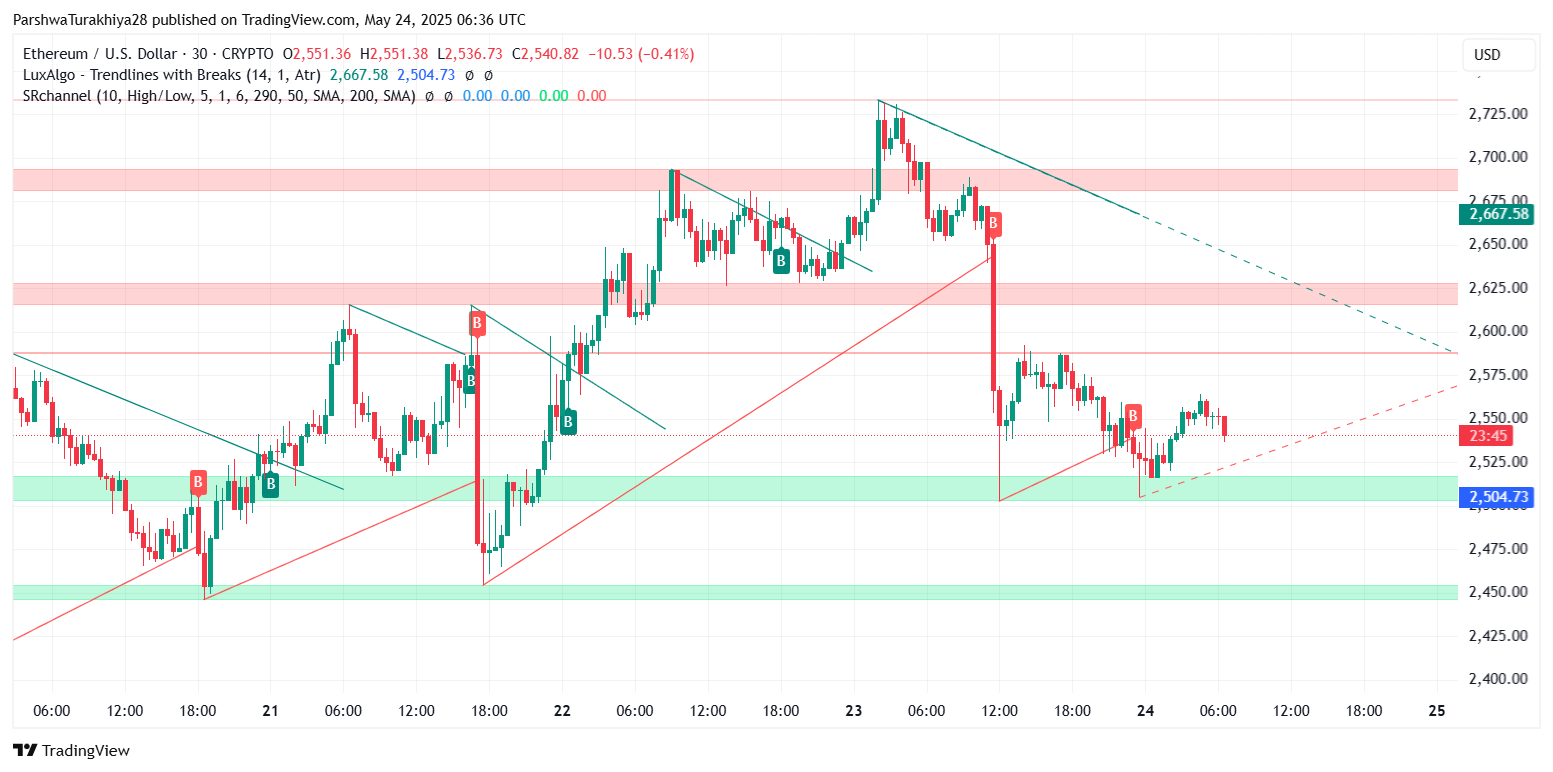
On the 30-minute chart, a clear descending resistance trendline capped recent upside attempts, with $2,575 now acting as immediate intraday resistance. If bulls manage to push above this zone, the next challenge will be the key supply zone between $2,620 and $2,667, where previous rejections occurred.
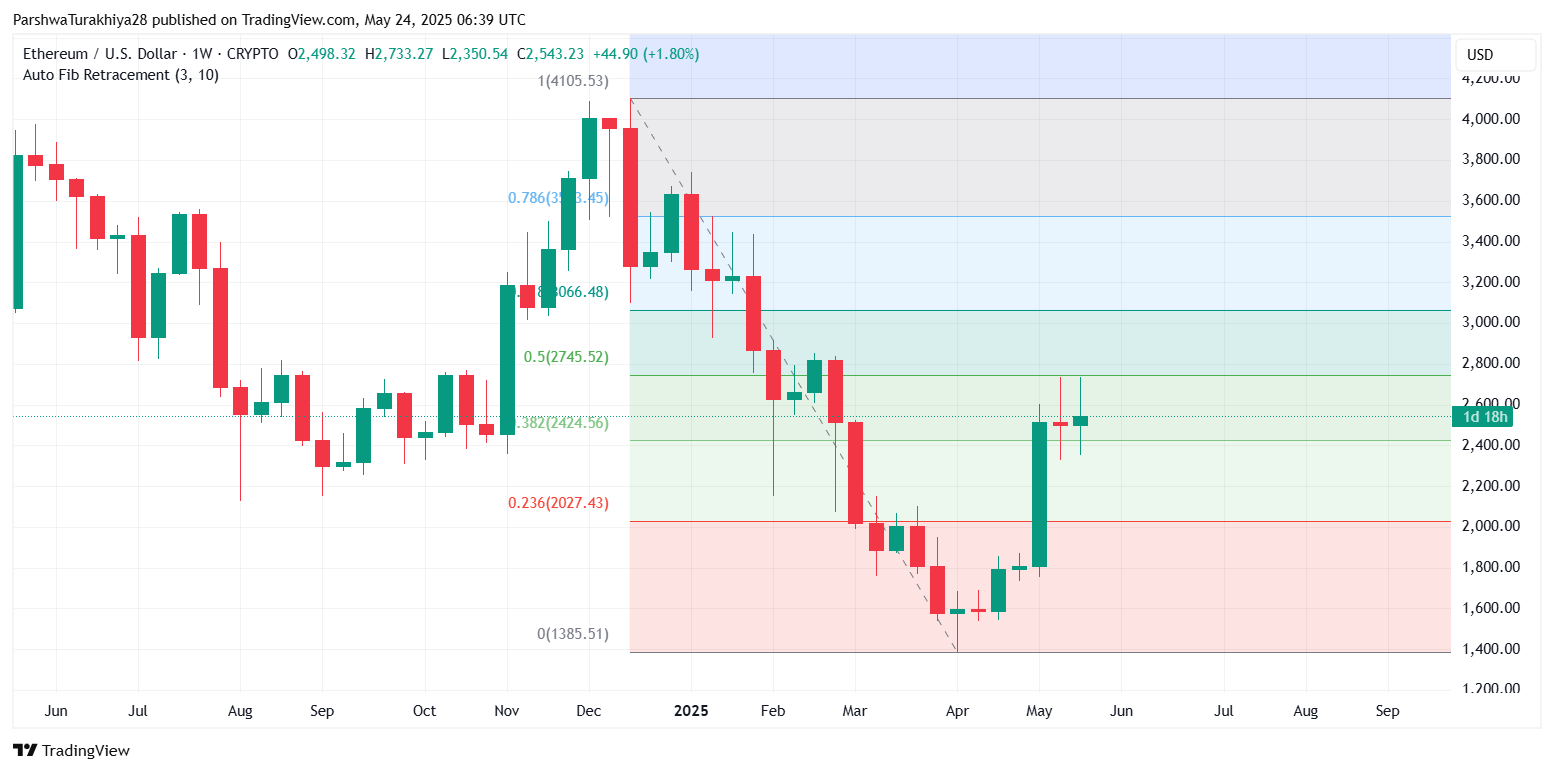
At the same time, the Fib retracement from the weekly top at $2,733 to the local low around $2,350 shows price holding near the 0.382 level ($2,424) and attempting to reclaim the 0.5 zone at $2,745. This area will be decisive for the Ethereum price update heading into the weekend.
Indicators Show a Neutral But Cautiously Bullish Bias
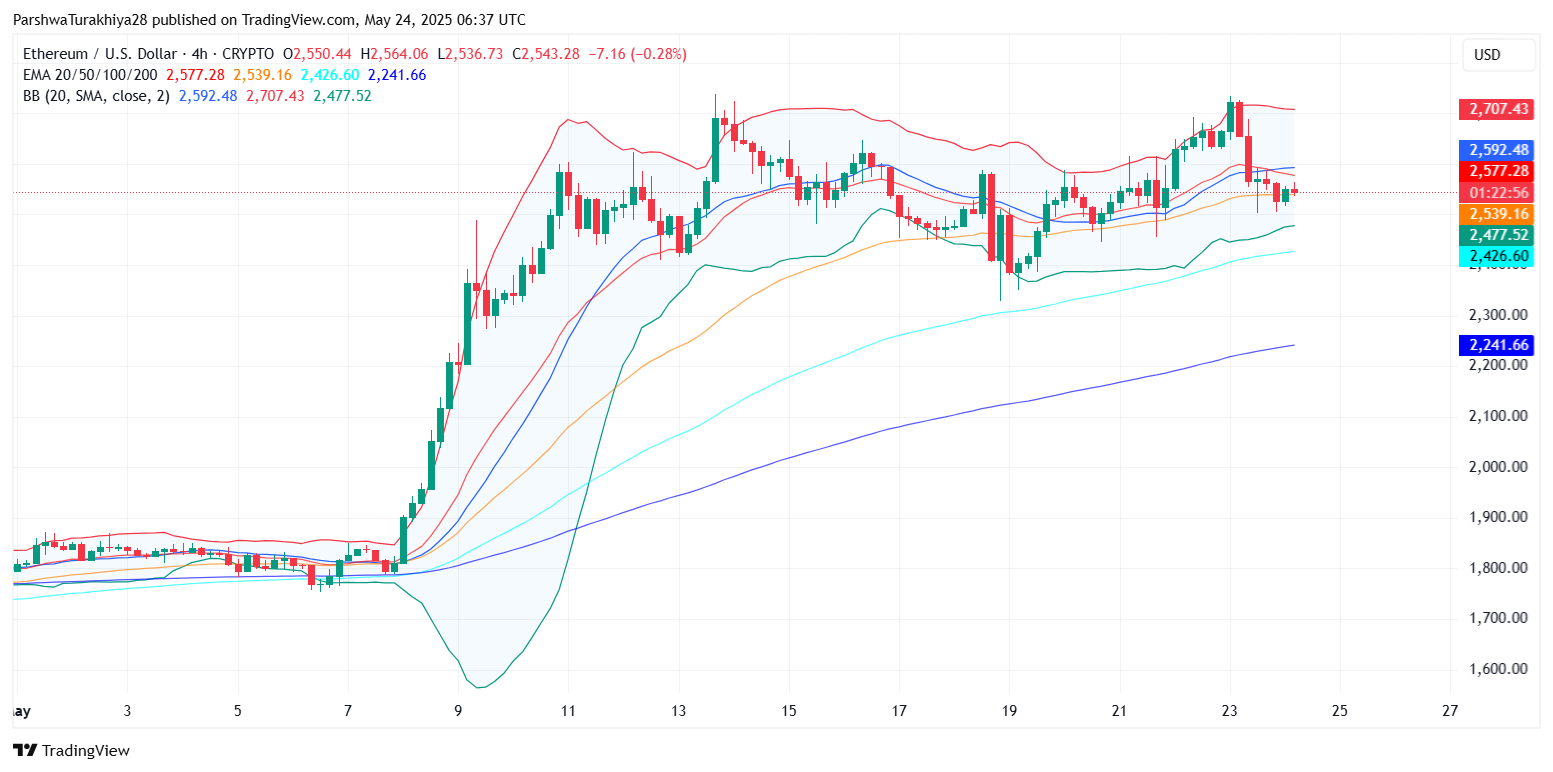
The 4-hour Bollinger Bands are narrowing, with price compressing between the midline and lower band. ETH is trading just under the middle band (now at $2,592), indicating that any breakout must reclaim this level first for bullish continuation. A clean move above $2,600 could trigger fresh Ethereum price spikes.
ETHUSD price analysis (Source: TradingView)
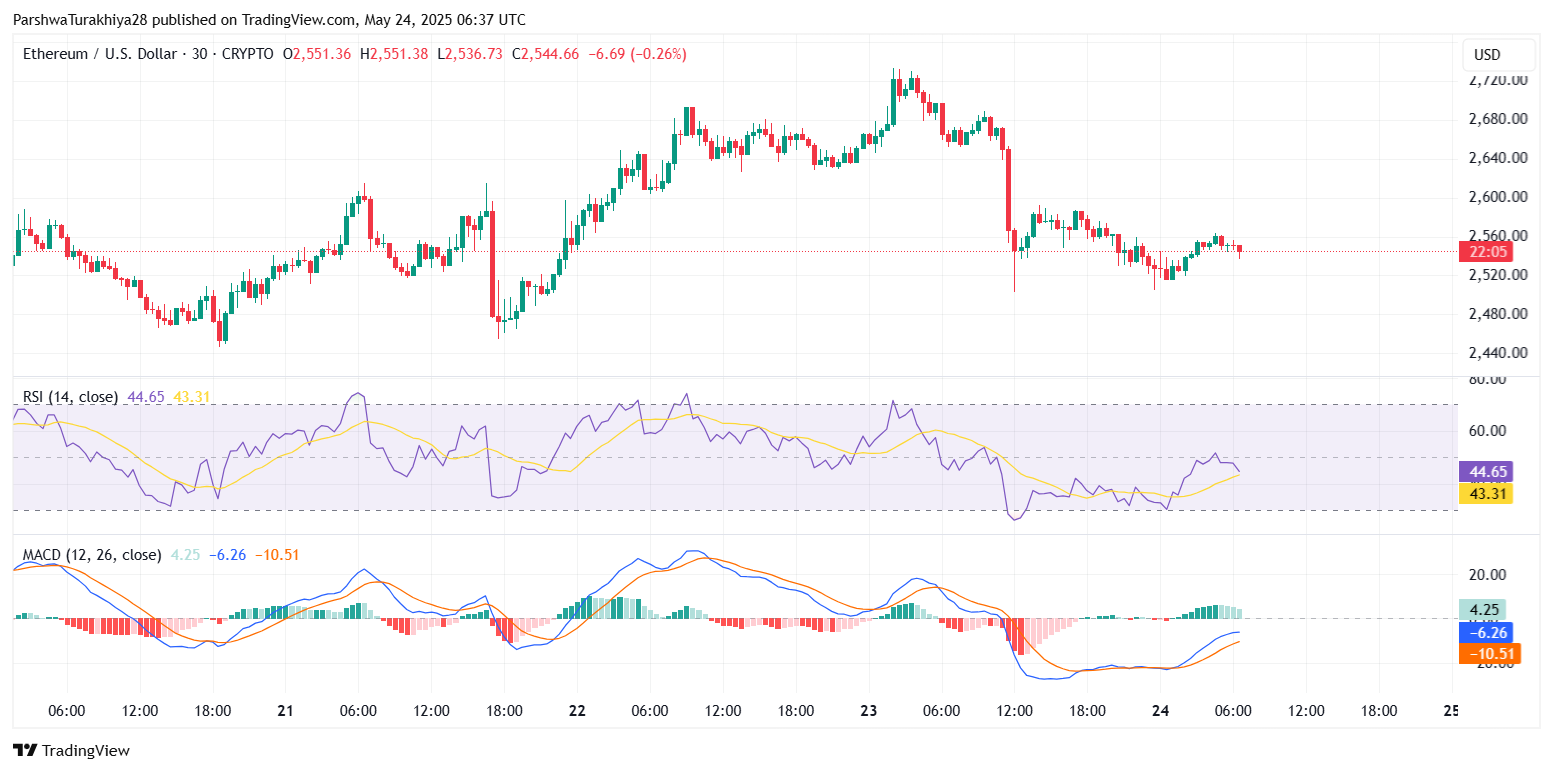
The RSI on the 30-minute chart stands at 44.65 and is trying to recover from oversold levels. A sustained move above 50 would confirm intraday strength. Meanwhile, the MACD has printed a mild bullish crossover, but histogram momentum remains muted, reflecting market hesitation.
ETHUSD price analysis (Source: TradingView)
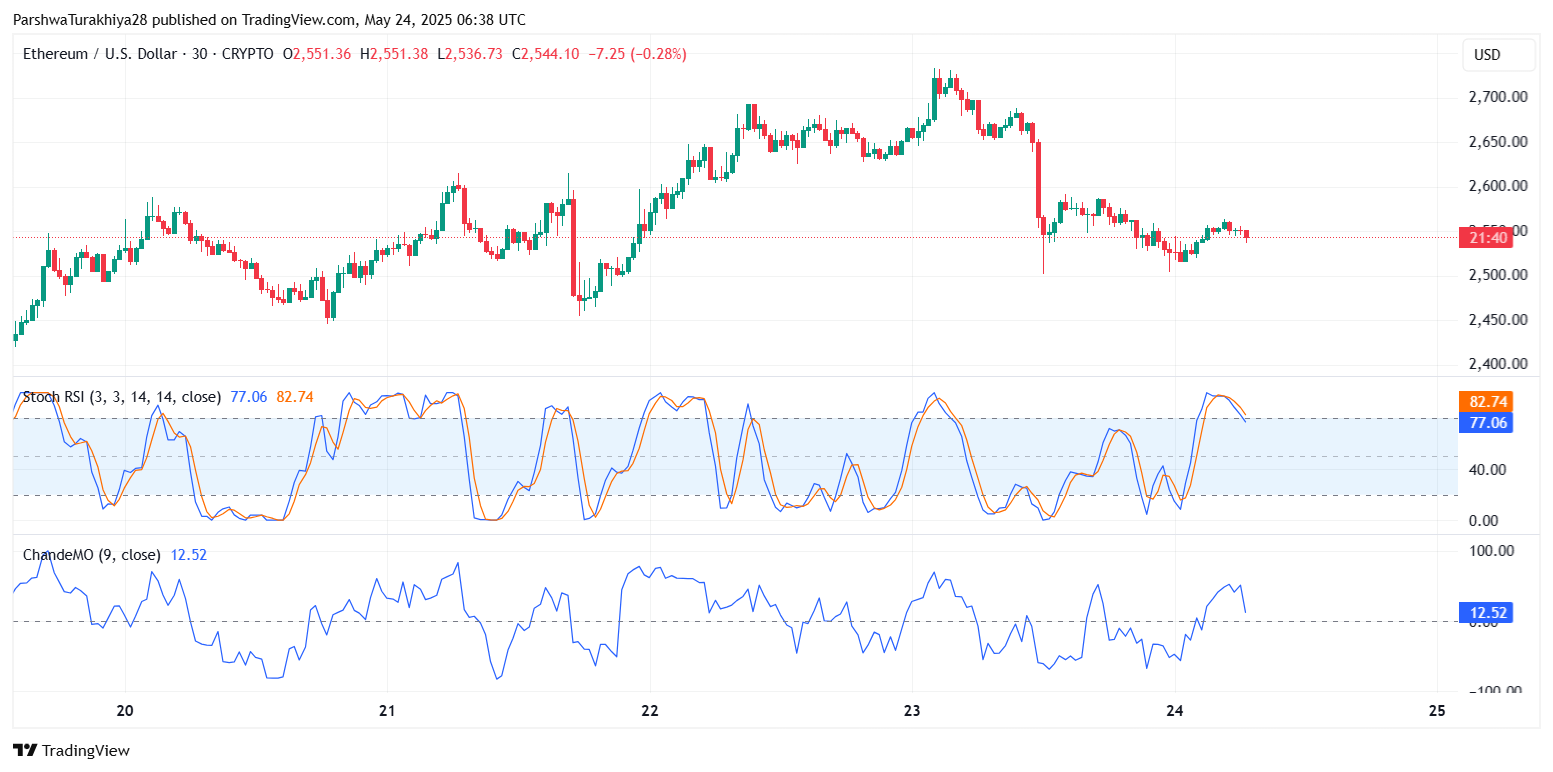
On the Stochastic RSI, ETH printed a sharp move into the overbought region (above 80), but the curve is now flattening, hinting at potential slowdown in upward momentum unless a breakout occurs. The Chande Momentum Oscillator (CMO) reads at 12.52, showing mild strength but not enough to confirm a new leg higher without volume.
ETHUSD price analysis (Source: TradingView)
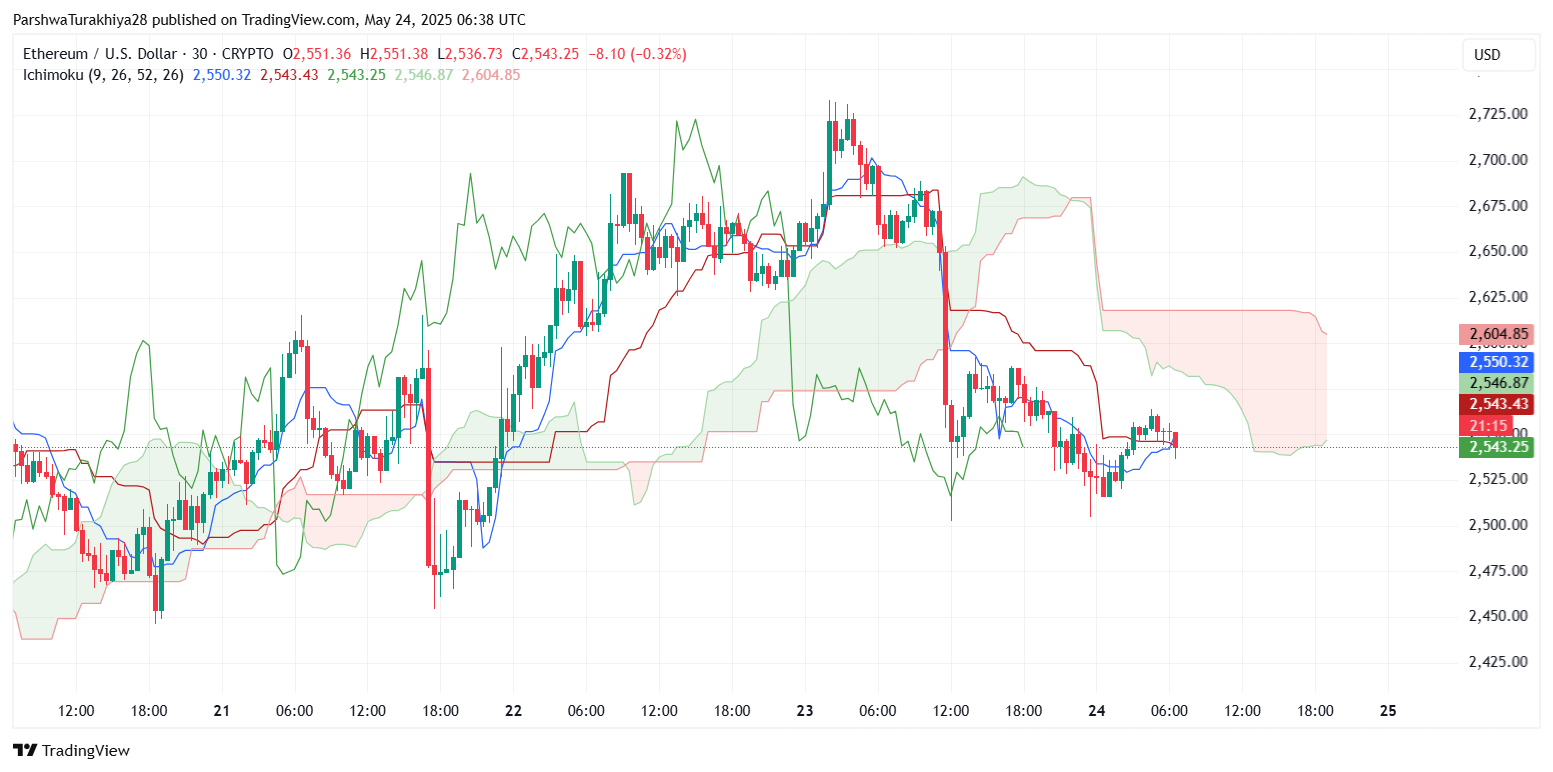
Ichimoku analysis on the 30-minute chart shows the price still battling the cloud’s lower boundary at $2,546.87. ETH needs to flip this into support to confirm a bullish Kumo breakout. For now, the bearish Tenkan-Kijun cross and thick overhead resistance cloud still weigh on short-term sentiment.
Why Ethereum Price Going Down Today?
ETHUSD price analysis (Source: TradingView)
The question is: why is the Ethereum price going down today despite holding above key support? The answer lies in macro-driven hesitation across altcoins and rejection near the $2,700 region, which coincides with long-standing daily resistance and profit-taking levels.
Furthermore, ETH has been unable to break above the 0.5 Fibonacci retracement at $2,745, suggesting that many traders are locking in gains after the strong May rebound. This has caused a temporary cooldown in Ethereum price action, though bulls remain structurally intact above the 100-EMA and major trendline zones.
Short-Term Forecast: Support, Resistance and Volatility Levels
Looking ahead to May 25, ETH’s behavior around the $2,500–$2,504 support will be critical. A break below this range could drag prices toward the next demand zone around $2,426. On the upside, reclaiming $2,575 and pushing toward $2,600 would be the first step toward recovery.
ETHUSD price analysis (Source: TradingView)
If bulls manage to flip $2,600 into support, we may see another retest of the $2,667–$2,700 zone. However, failure to hold above $2,500 would expose ETH to deeper correction, potentially toward $2,424 or even $2,350. Still, the broader bias remains cautiously bullish as long as $2,426 holds on higher timeframes.
As it stands, the Ethereum price volatility has compressed, but traders should remain alert to a possible breakout as price hovers near key decision levels. May 25 could define whether ETH gears up for another upward push or retraces toward deeper consolidation zones.
Disclaimer: The information presented in this article is for informational and educational purposes only. The article does not constitute financial advice or advice of any kind. Coin Edition is not responsible for any losses incurred as a result of the utilization of content, products, or services mentioned. Readers are advised to exercise caution before taking any action related to the company.


Leave a Reply