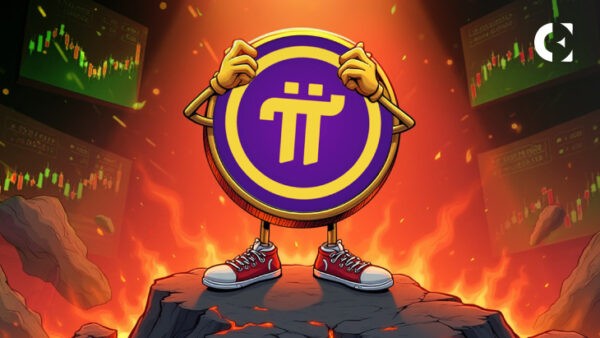
Ali Martinez flags a Bollinger Bands squeeze on the 4-hour XRP chart, signaling reduced volatility and a potential major price move.
Over the Easter weekend, XRP emerged as one of the stronger performers in the crypto market’s broad recovery phase. The asset, which recently faced downward pressure, showed a swift rebound from its recent dip.
On April 20, XRP briefly dropped to near $2.03 but recovered sharply to cross $2.10 today. Currently, XRP trades at $2.13, reflecting a 2.53% gain over the past 24 hours. In addition, it is observing a marginal 0.06% rise in the last week.
Technical Patterns Indicate Volatility Shift
Amid this recovery, Ali Martinez, a widely-followed crypto analyst on X, shared a 4-hour XRP chart illustrating a notable Bollinger Bands squeeze. The indicator, which includes a 20-period simple moving average and two standard deviation bands, currently shows significantly reduced volatility. Historically, this tightening pattern often signals an upcoming sharp move in price, though the direction remains uncertain.
The Bollinger Bands are squeezing on the $XRP 4-hour chart, signaling that a major price move could be just around the corner. pic.twitter.com/Yeu0f71PPG
— Ali (@ali_charts) April 20, 2025
According to Martinez’s chart, XRP has traded within a confined horizontal range between $2.04 and $2.12. Recent candlesticks have struggled to maintain closes above the middle Bollinger Band, which sits near $2.08–$2.09.
This price area has emerged as short-term resistance. At the same time, the lower boundary of the range, near $2.04, has consistently drawn buying interest, evidenced by repeated long lower wicks. This suggests that buyers continue to defend the support zone, with the analyst suggesting a major price move could be around the corner.
Price Forecasts Remain Divided
While Martinez highlights technical setups hinting at a near-term move, other analysts continue to evaluate XRP’s long-term positioning. Doctor Cat, another prominent market watcher, projects a minimum price of $4.50 for XRP, even in a bearish macro environment.
He bases this projection on several technical indicators, including the XRP/BTC ratio and the 1.618 Fibonacci extension.
His model assumes the current bottom remains intact and acknowledges that a daily close below $1.69 on the 2-day Ichimoku Cloud could challenge the setup. Still, he estimates a 50% probability that XRP has already reached its local bottom, based on his time cycle assessment.
Valuation Metrics Through Bitcoin Lens
Meanwhile, Bitcoin maximalist and JAN3 CEO Samson Mow presented an alternative valuation method for XRP and other altcoins. He recalculated XRP’s market cap—around $122 billion at the time—by dividing it over Bitcoin’s 21 million token supply.
This analysis yields an equivalent XRP price of approximately $5,800 per “Bitcoin-sized share.” Mow used this to illustrate the impact of unit bias, where investors perceive low-price tokens as undervalued without considering total supply.
Mow extended this method to Ethereum and Solana. Ethereum, with a $193 billion market cap, would equate to $9,200 per share. Solana’s $71 billion market cap converts to about $3,400 per share. He emphasized that such recalculations reveal the real market valuations of high-supply assets, challenging the idea that lower-priced tokens necessarily represent better value.


Leave a Reply