XRP price today is trading near $2.50, recovering from a sharp pullback after failing to sustain above the $2.60 zone. This price rejection comes after a notable XRP price spike toward $2.65 on May 12, which marked the upper boundary of a key resistance range. Over the weekend, XRP broke out of a descending wedge pattern, rallying past major resistance levels at $2.35 and $2.45, triggering short-term momentum.
XRPUSD price dynamics (Source: TradingView)
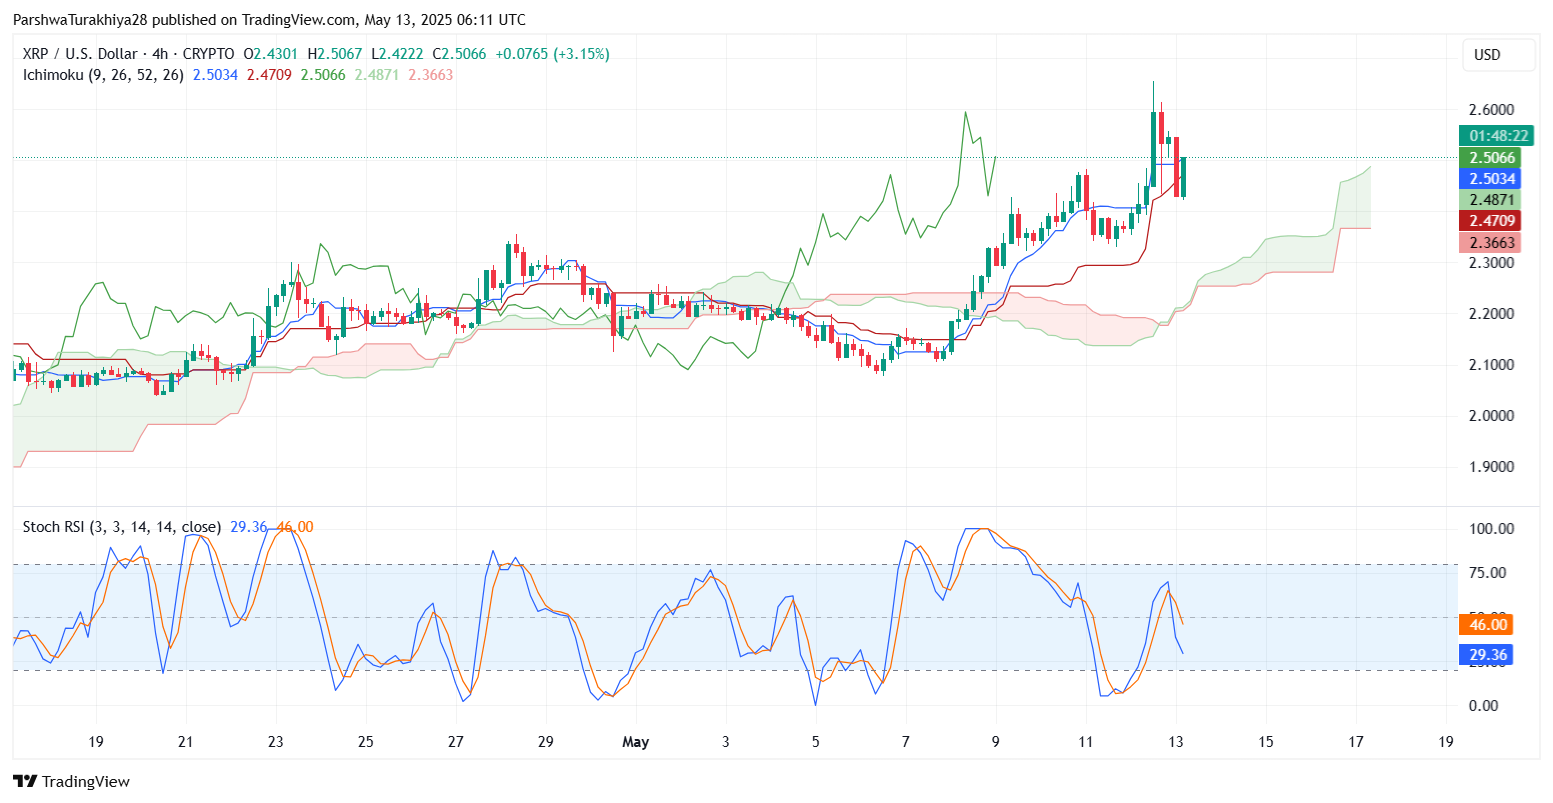
Looking at the XRP price update, the 4-hour chart shows a healthy structure of higher lows forming after a successful retest of previous resistance-turned-support. However, traders remain cautious as the asset shows signs of intraday exhaustion after a near 25% rally from the May 8 low.
XRP Price Action Faces Resistance: What Do the Charts Say?
XRPUSD price dynamics (Source: TradingView)
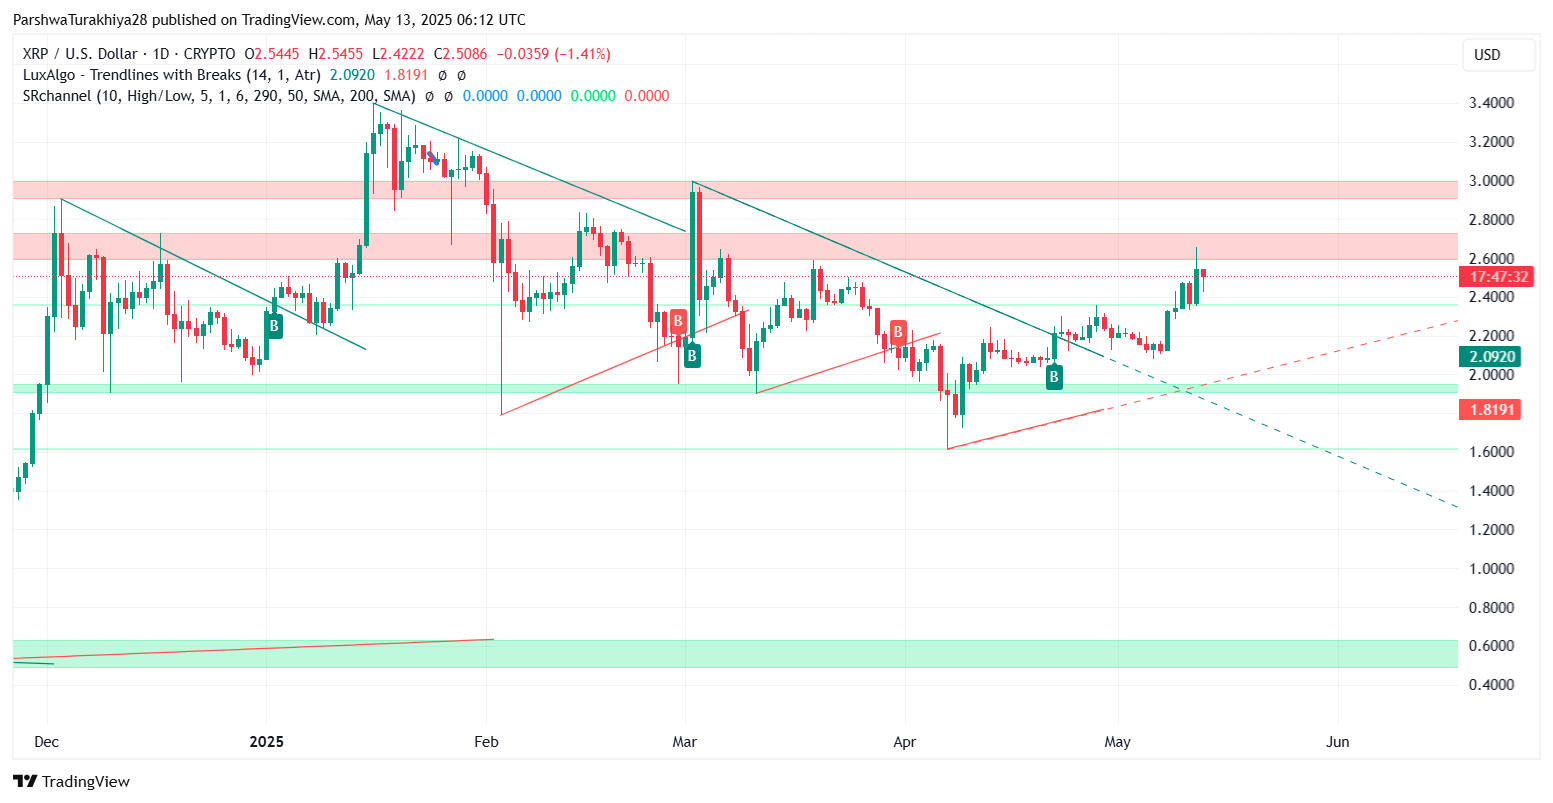
On the daily timeframe, XRP price action broke above a multi-month descending trendline, clearing key resistance around $2.25. The move was accompanied by a strong RSI surge, which has now cooled back to the neutral zone. The latest candle shows a long upper wick, indicating profit-taking pressure near the 0.618 Fibonacci retracement level around $2.71.
XRPUSD price dynamics (Source: TradingView)
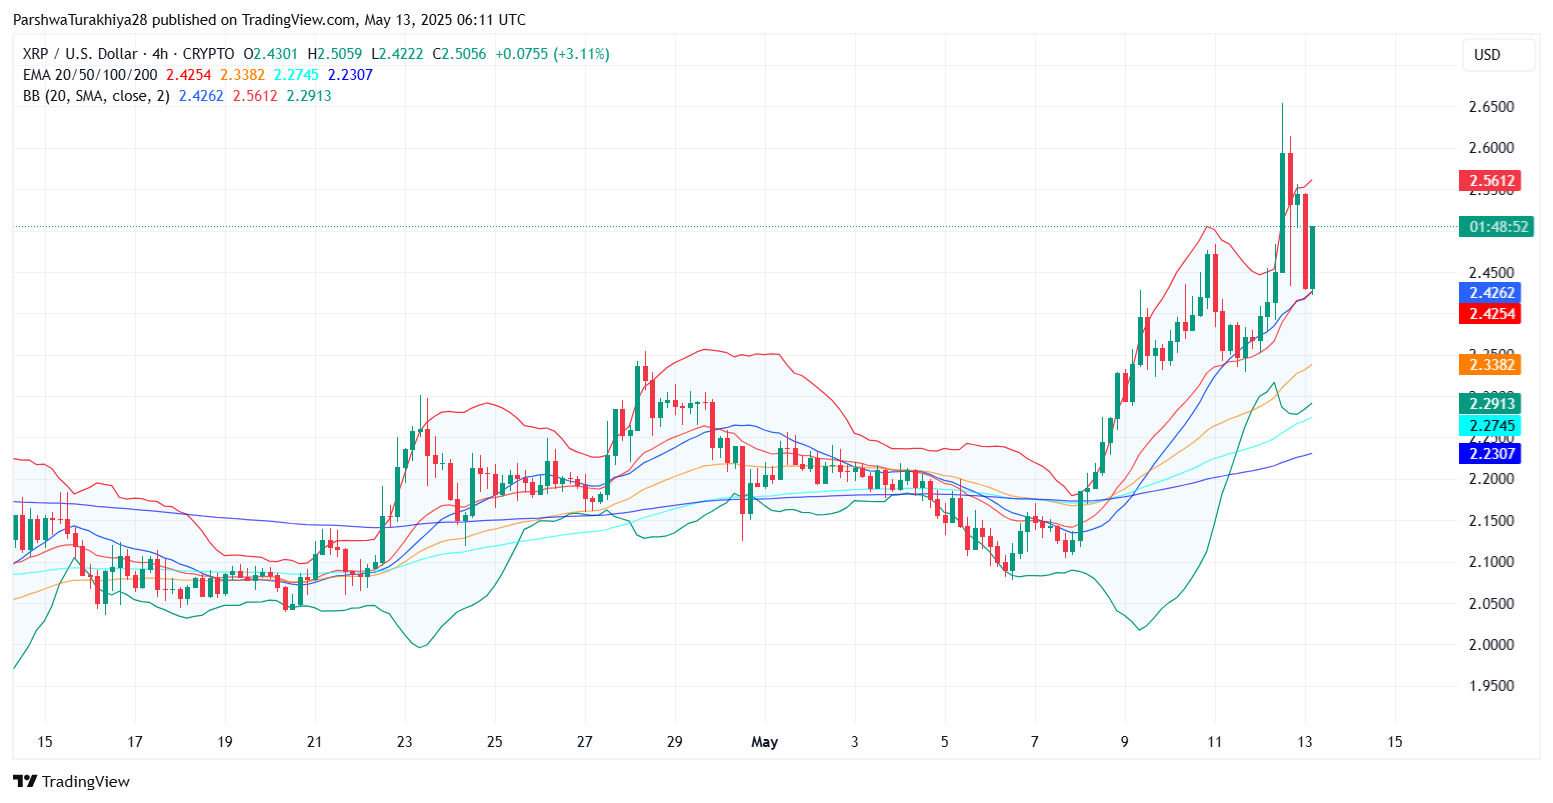
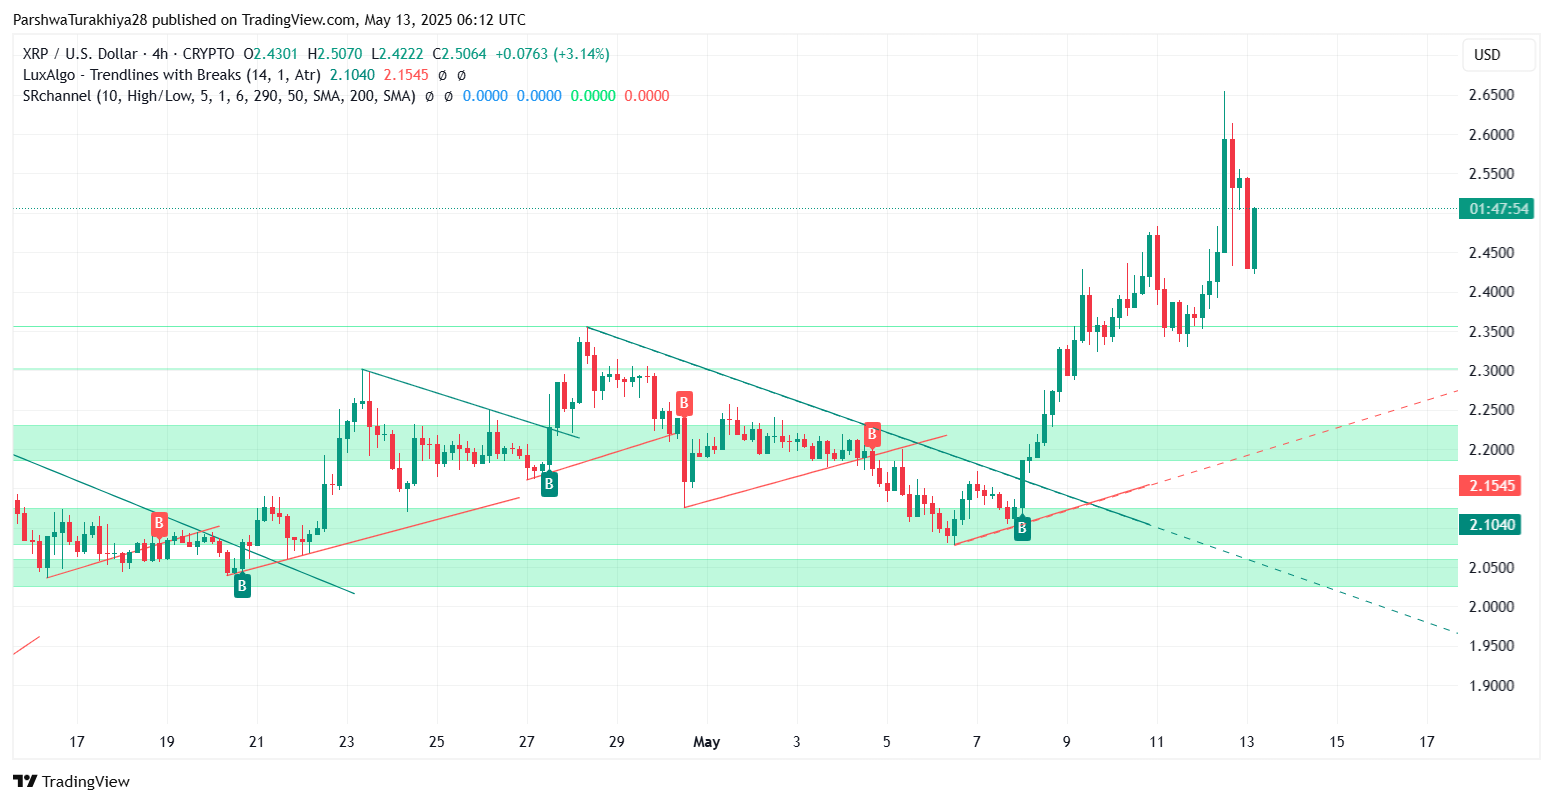
On the 4-hour chart, XRP has entered a consolidation range between $2.45 and $2.58. The Bollinger Bands are wide, reflecting elevated XRP price volatility, while the price remains above the 20-EMA ($2.43) and 50-EMA ($2.33), both offering dynamic support. A sustained hold above $2.45 keeps the bullish bias intact. The MACD histogram is turning positive again after a short dip, hinting that buyers may re-enter if the $2.50 level holds.
XRPUSD price dynamics (Source: TradingView)
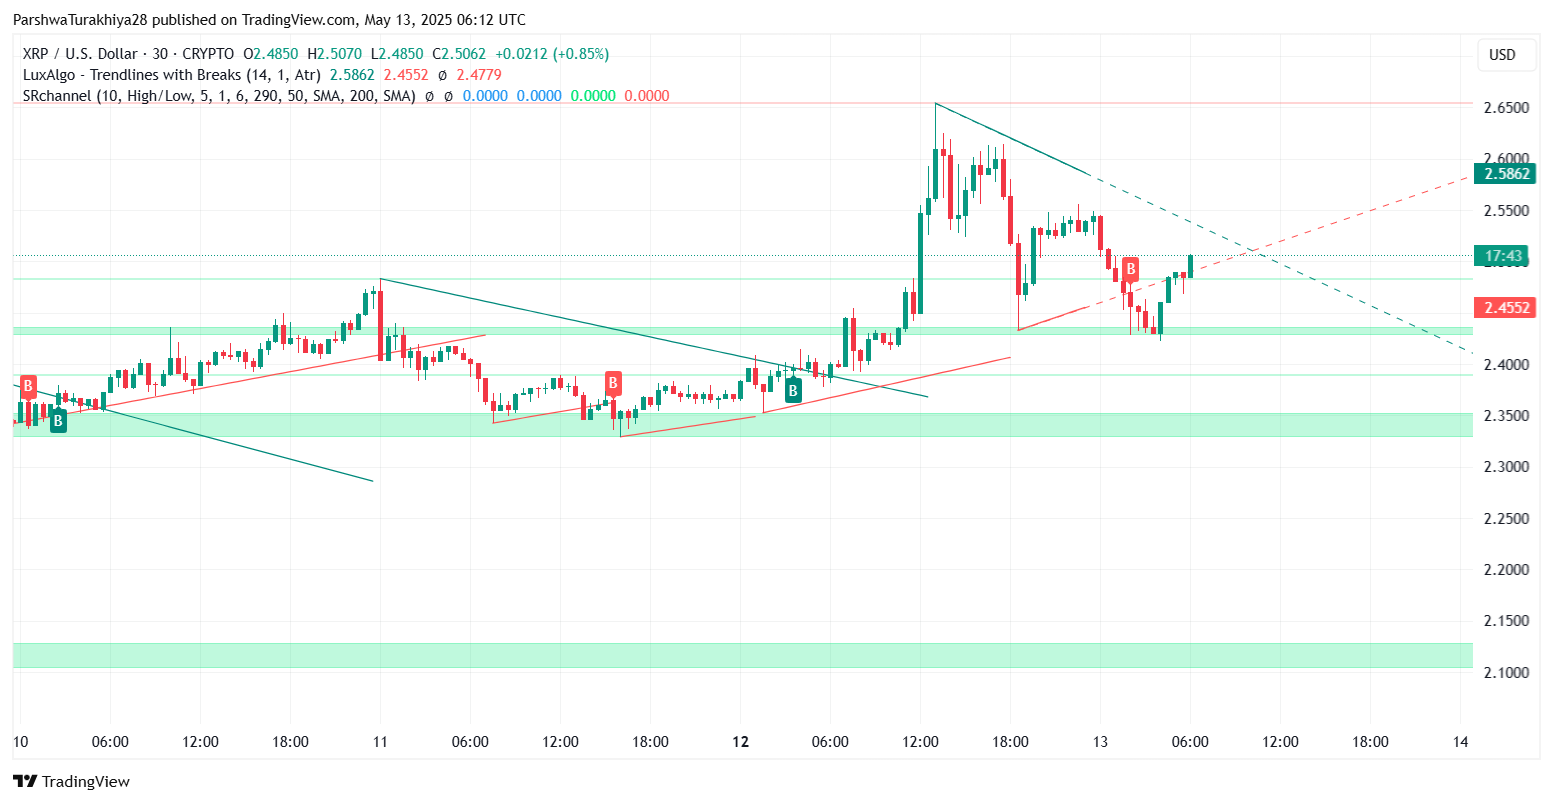
Ichimoku Cloud support on the 4-hour is intact, with price hovering just above the cloud and Tenkan-Sen baseline at $2.47. This supports the idea of a continuation move if volume increases. The 30-minute chart confirms this narrative, showing XRP reclaiming a falling wedge breakout near $2.48 with a short-term target back at $2.58 and then $2.65.
Why XRP Price Going Up Today?
XRPUSD price dynamics (Source: TradingView)
Why XRP price going up today is largely tied to the breakout from its April downtrend and recent reclaim of multi-week support. The bullish sentiment was reinforced by the break above $2.35, a zone that capped rallies in late April and early May. With market-wide altcoin strength resuming, XRP followed suit with increased volume during the upside move.
Also notable is the weekly Fibonacci retracement level near $2.50, which aligns with the 0.5 fib zone of the Nov–March downtrend. If XRP closes above this threshold, the next major resistance lies near $2.71, followed by $3.01.
XRP Price Forecast: Levels to Watch for May 14
Heading into May 14, the short-term outlook remains cautiously bullish. Key levels to monitor include:
Momentum indicators like RSI (currently near 53 on the 30-min chart) and MACD crossover suggest buyers are trying to regain control. However, failure to hold above $2.45 may invite sellers toward $2.35 again.
The XRP price remains in a constructive phase as long as $2.45 holds. The recent rally has not entirely lost steam, but momentum needs to build soon to challenge $2.65–$2.71 again. A break above that zone would open doors toward $2.85 and possibly $3.00. For now, May 14 could be a decisive session as traders gauge whether this pullback was just a pause or the start of broader profit-taking.
For context, our May 13 XRP forecast had already flagged the $2.25–$2.35 breakout zone, which is now acting as key structural support.
Disclaimer: The information presented in this article is for informational and educational purposes only. The article does not constitute financial advice or advice of any kind. Coin Edition is not responsible for any losses incurred as a result of the utilization of content, products, or services mentioned. Readers are advised to exercise caution before taking any action related to the company.


Leave a Reply