
After nearly two months of sideways trading, Cardano (ADA) price broke above the $0.74 resistance level, confirming a technical breakout that may pave the way for a price rally toward $1.20.
This bullish momentum is supported by increased derivatives activity, a surge in staking, and strong market interest that has pushed ADA’s price close to $0.80 as of press time.
Cardano Price Movement and Technical Confirmation
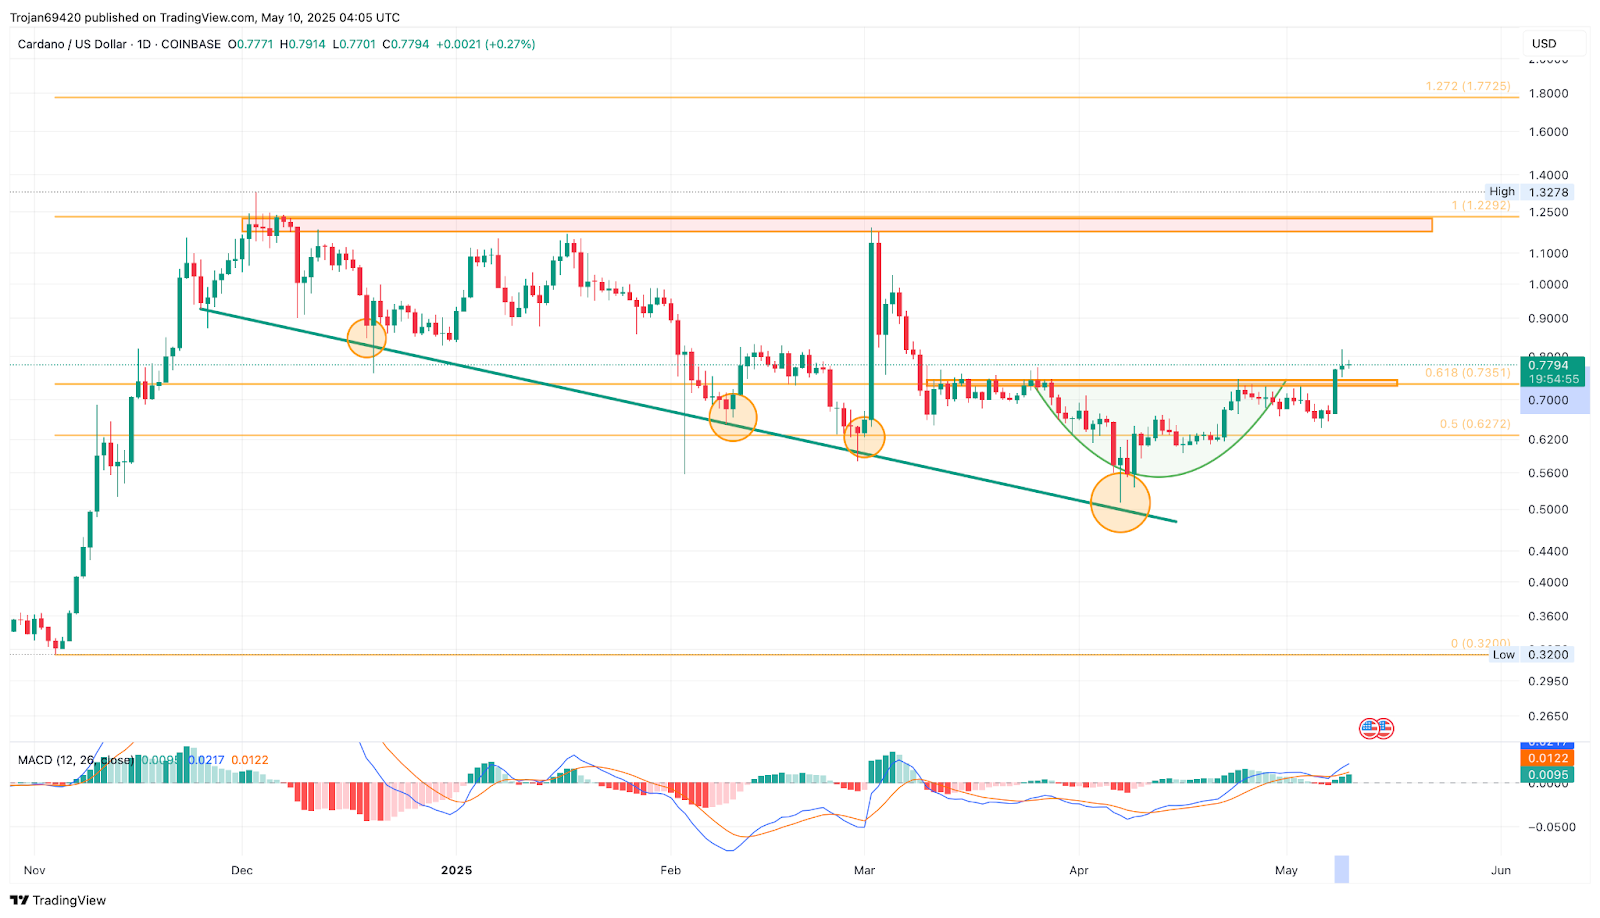
Cardano’s price has risen by over 20% from its recent seven-day low of $0.6425. It crossed the $0.74 resistance level with a daily close at $0.7693. This zone had held as resistance for nearly two months and coincides with the 61.80% Fibonacci retracement level.
The breakout above this point signals renewed buyer strength and invalidates the prior consolidation range. Analysts from Rose Premium Signals note that ADA broke out of a bullish flag pattern that began forming in November 2024.
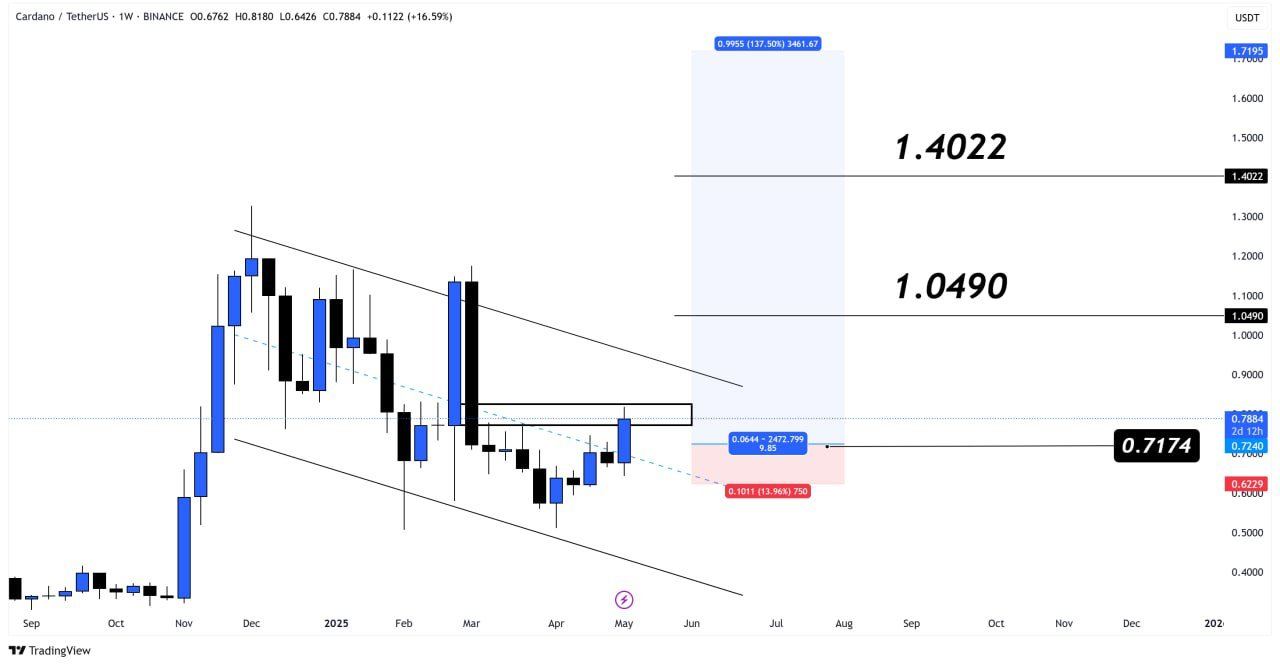
The pattern’s breakout suggests a potential reversal in trend, with near-term targets set at $0.7192, $1.0490, and $1.4022. The current price action is also retesting the $0.74 zone as new support, reinforcing the bullish setup.
Source: X
Cardano price closed above the 50-day, 100-day, and 200-day Exponential Moving Averages (EMAs). That is a structure often associated with sustained upward trends. The MACD indicator also shows a bullish crossover, which may support the price’s continuation toward higher levels.
Derivatives Activity and Open Interest Surge
Cardano’s open interest has exceeded $900 million, signaling increased leveraged trading. With a neutral funding rate of 0.0103%, longs and shorts are balanced. This setup often leads to sharp price moves, as traders prepare for a breakout or breakdown in ADA’s price direction.
Short liquidations that rose sharply between April 25 and May 9 have added fuel to the upward momentum as well. Analysts noted that as ADA’s price was rising, many short positions were disappearing through liquidation. This created a short squeeze phenomenon.
From May 8 to May 9, the red “bar spikes” on liquidation charts signaled strong peak short covering, propelling ADA closer to the $0.80 level.
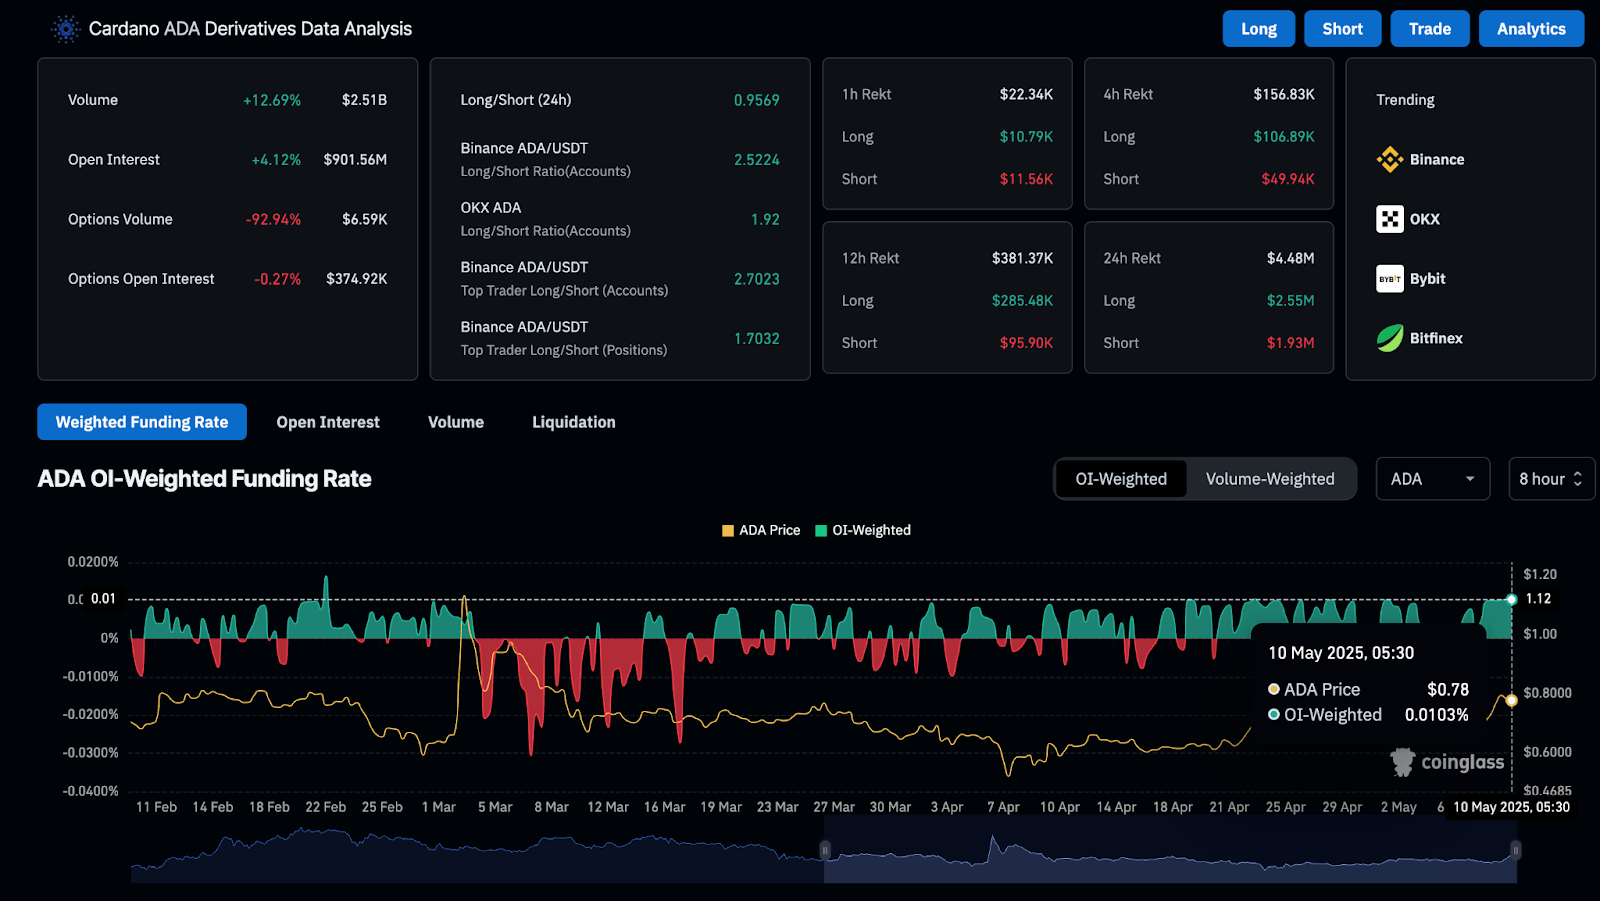
Source: CoinGlass
The 24 hour market volume for ADA is recorded at $1.37 billion. This high level of trading; down by 1.58% from the previous day, still shows positive market involvement and buying interest. The volume-to-market cap ratio stays: 5.01% that means moderate but stable demand in the spot market.
Staking Activity and Supply Structure
The increase in the price of ADA is also fueled by increased staking participation. Increasingly more users are locking up ADA tokens to contribute to network security and win rewards; the effect is to reduce supplies and possibly more pressure on price.
Cardano is capped at a total supply of 45 billion ADA while approximately 35.31 billion ADA are in circulation. That means approximately 78.5% of all ADA is already out in trading, which will be constraining any future dilution. This structure of supply is considered developed and has been observed to be a point of support regarding ADA’s sustained value.
As staking levels ramp up and the supply of tokens that can be sold plummets, upward price movement can speed during surges of demand. This is increasingly observable as ADA continues to trade above major moving averages.
Cardano Price Short-Term Resistance and Risk Levels
ADA’s price has encountered some rejection near the $0.81 zone, despite the breakout. The hourly chart failed to maintain above $0.7969, sending short-term selling pressure. A day close away from this resistance could lead to a pullback to the $0.76 support level.
If this zone remains valid, the price may set a base before another advance to $0.85 and the wider target of $1.20. However, a failure to maintain support at $0.74 would challenge the bullish case and may lead ADA to retest the $0.62 area, aligning with the 50% Fibonacci support.
Source: TradingView
A chart analysis by TradingView shows that a weekly close above $0.7786 may allow continuation toward the $0.85 mark in the coming days.
The breakout from the descending broadening wedge pattern formed since December 2024 adds to this outlook. If ADA tests and surpasses the $1.20 supply zone, the next level on the Fibonacci scale is at $1.77.


Leave a Reply