- XRP price indicators send multiple buy signals, supported by low exchange inflows.
- The SuperTrend turns green for the first time since March, setting the stage for gains toward $3.00.
- Surging long positions liquidations alongside falling Open Interest may slow XRP’s uptrend.
Ripple (XRP) price continues its upward trajectory, trading at $2.40 on Monday, fuelled by a widespread bullish surge spearheaded by Bitcoin (BTC) breaking past the $100,000 mark last week. Multiple buy signals suggest that XRP can potentially extend the rally, targeting $3.00 in the coming days.
XRP gains momentum as exchange inflows diminish
XRP’s price has broken above a long-term descending trendline resistance, mirroring positive sentiment across the crypto market. The uptrend above the trendline comes amid a major slump in exchange inflows from over 2 billion to 14.5 million XRP, per CryptoQuant data.
Falling exchange inflows often signal reduced sell-side pressure, as investors prefer to hold onto their tokens in self-custody as opposed to moving them to exchanges.

Exchange inflows | Source: CryptoQuant
Meanwhile, the daily chart reveals a solid bullish structure supported by multiple buy signals. The SuperTrend recently shifted below XRP’s price, supporting the ongoing uptrend. This trend-following indicator signals when to buy and when to sell.
When XRP’s price is above the SuperTrend line, it signals a bullish momentum. For instance, around late November 2024, the price broke above the Supertrend line, marking the start of a major bullish phase that propelled XRP from around $0.50 to a peak near $3.38 by mid-January.
With the SuperTrend line below XRP’s price, dynamics could favour a larger-than-expected breakout aiming for highs above $3.00.
The Moving Average Convergence Divergence (MACD) indicator shows a clear uptrend above the center line. The MACD line (0.0557) above the signal line (0.0318) signals a robust bullish momentum.
Similarly, the expanding green histograms confirm this short-term bullish outlook, corroborated by the Relative Strength Index (RSI) at 61.77. The RSI indicator shows that XRP is neither overbought nor oversold, leaving room for more bullish wiggle.
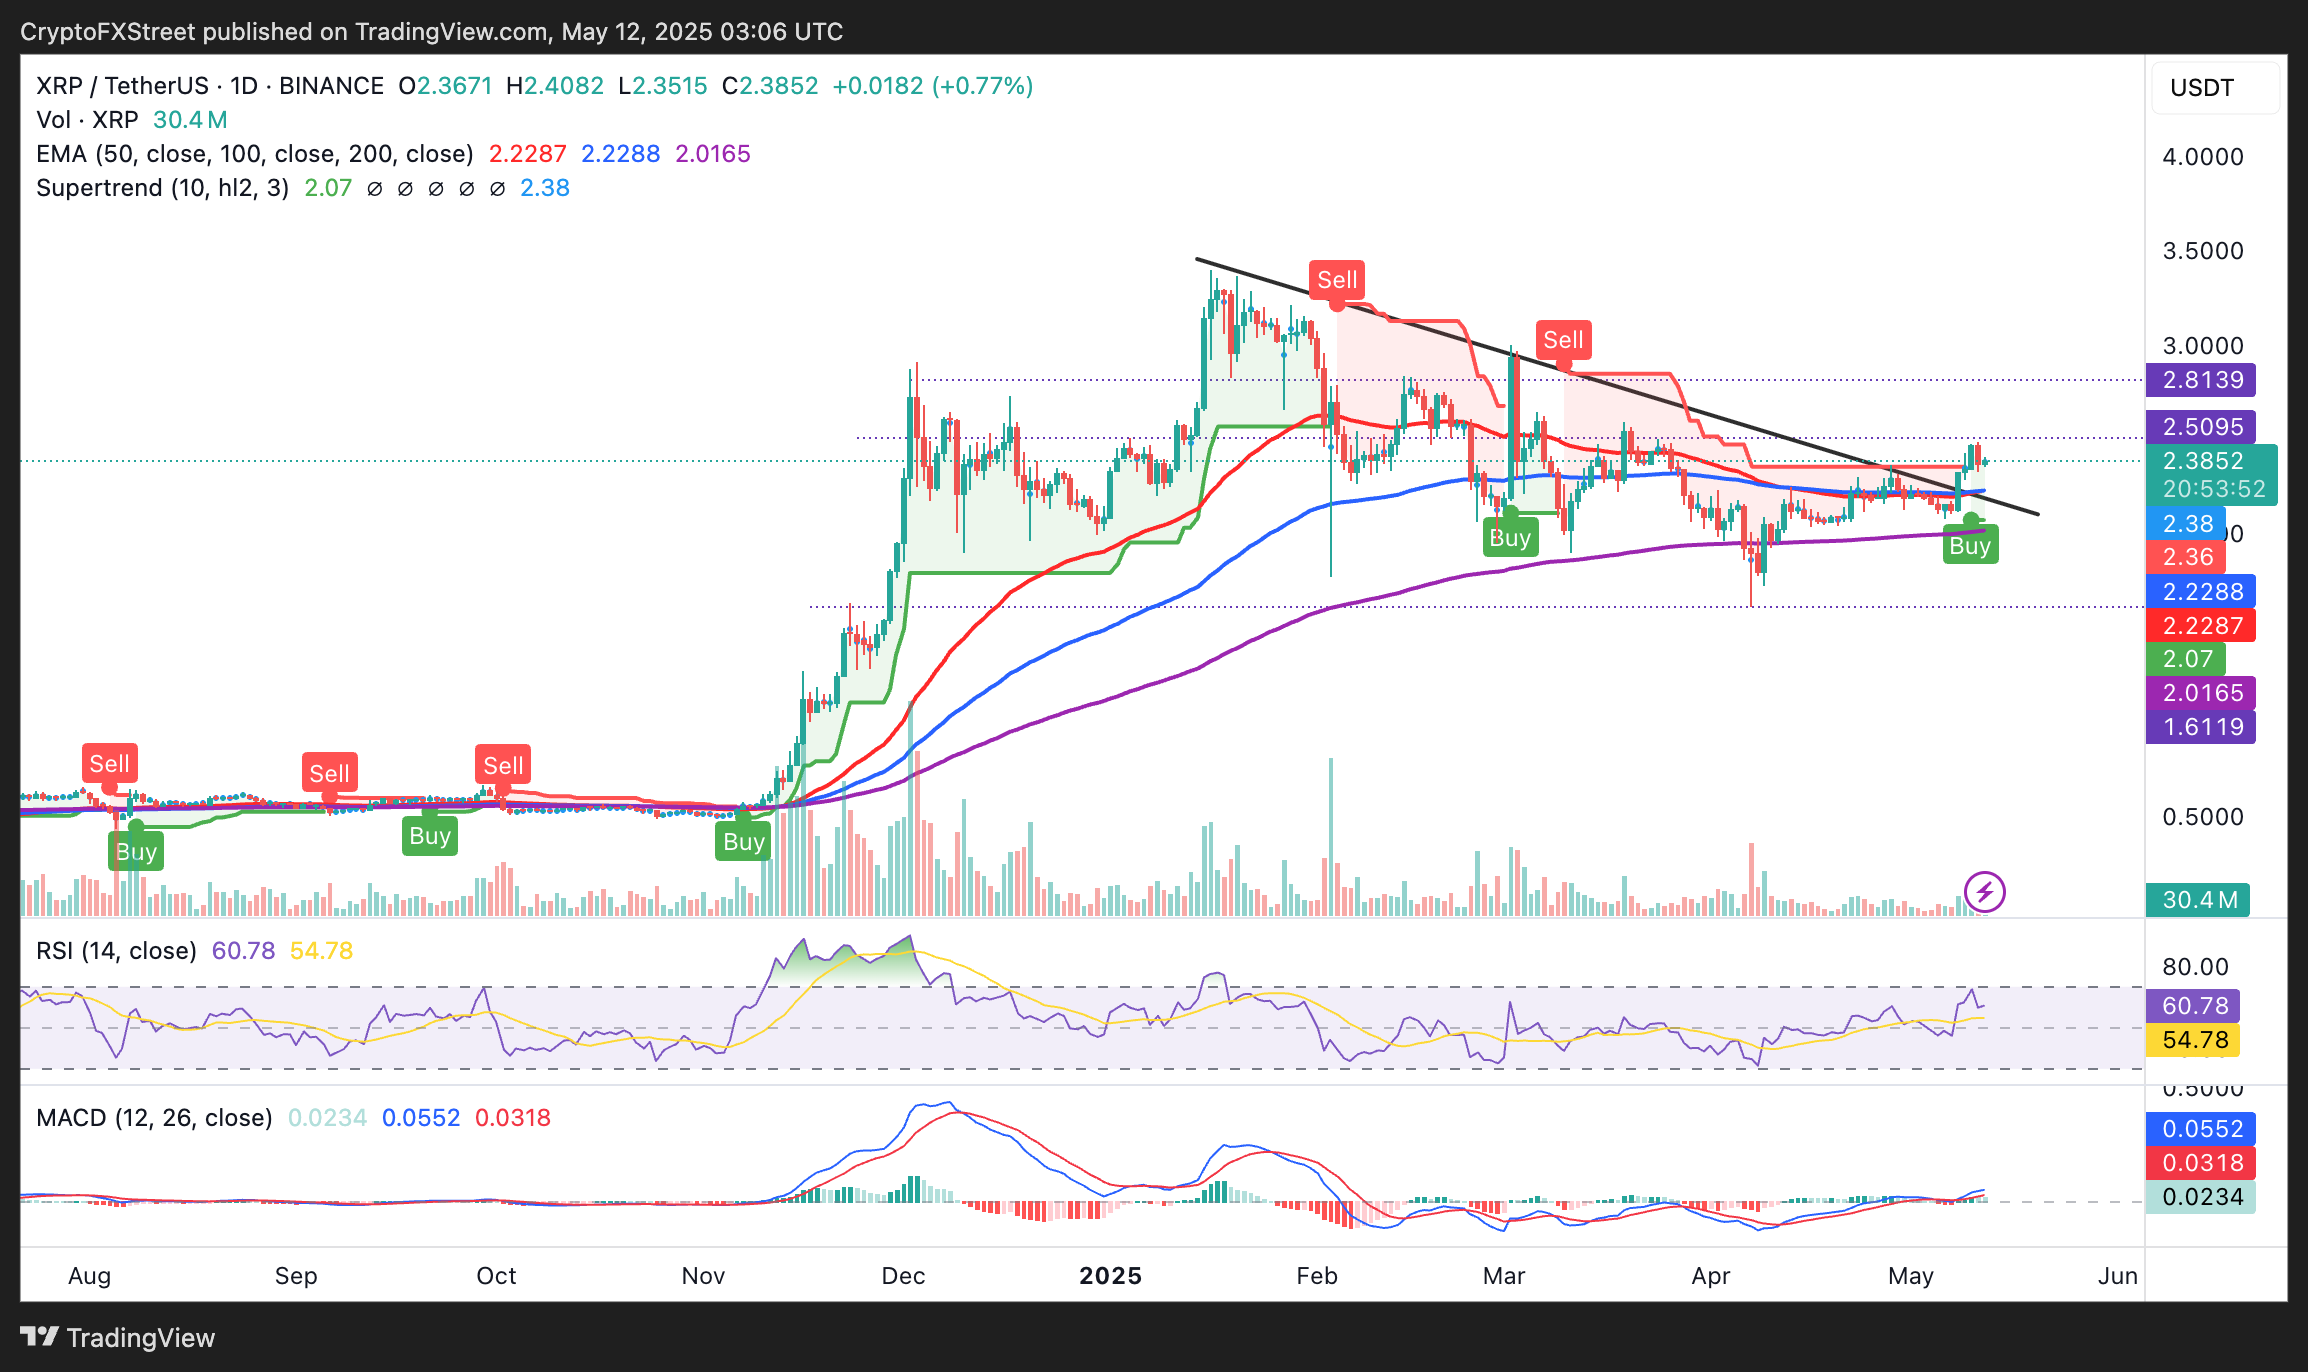
XRP/USDT daily chart
Declining Open Interest may hinder XRP’s upward momentum
Derivatives data from CoinGlass reveals a 2.21% drop in Open Interest (OI) to $6.64 billion and a 27.24% decline in the trading volume to $5.74 billion. OI represents the total number of outstanding derivative contracts that haven’t been settled, like futures or options.
When OI falls, it signals that traders are closing positions, reflecting reduced confidence or interest in XRP’s price direction. Coupled with the drop in trading volume, the uptrend could face significant challenges.
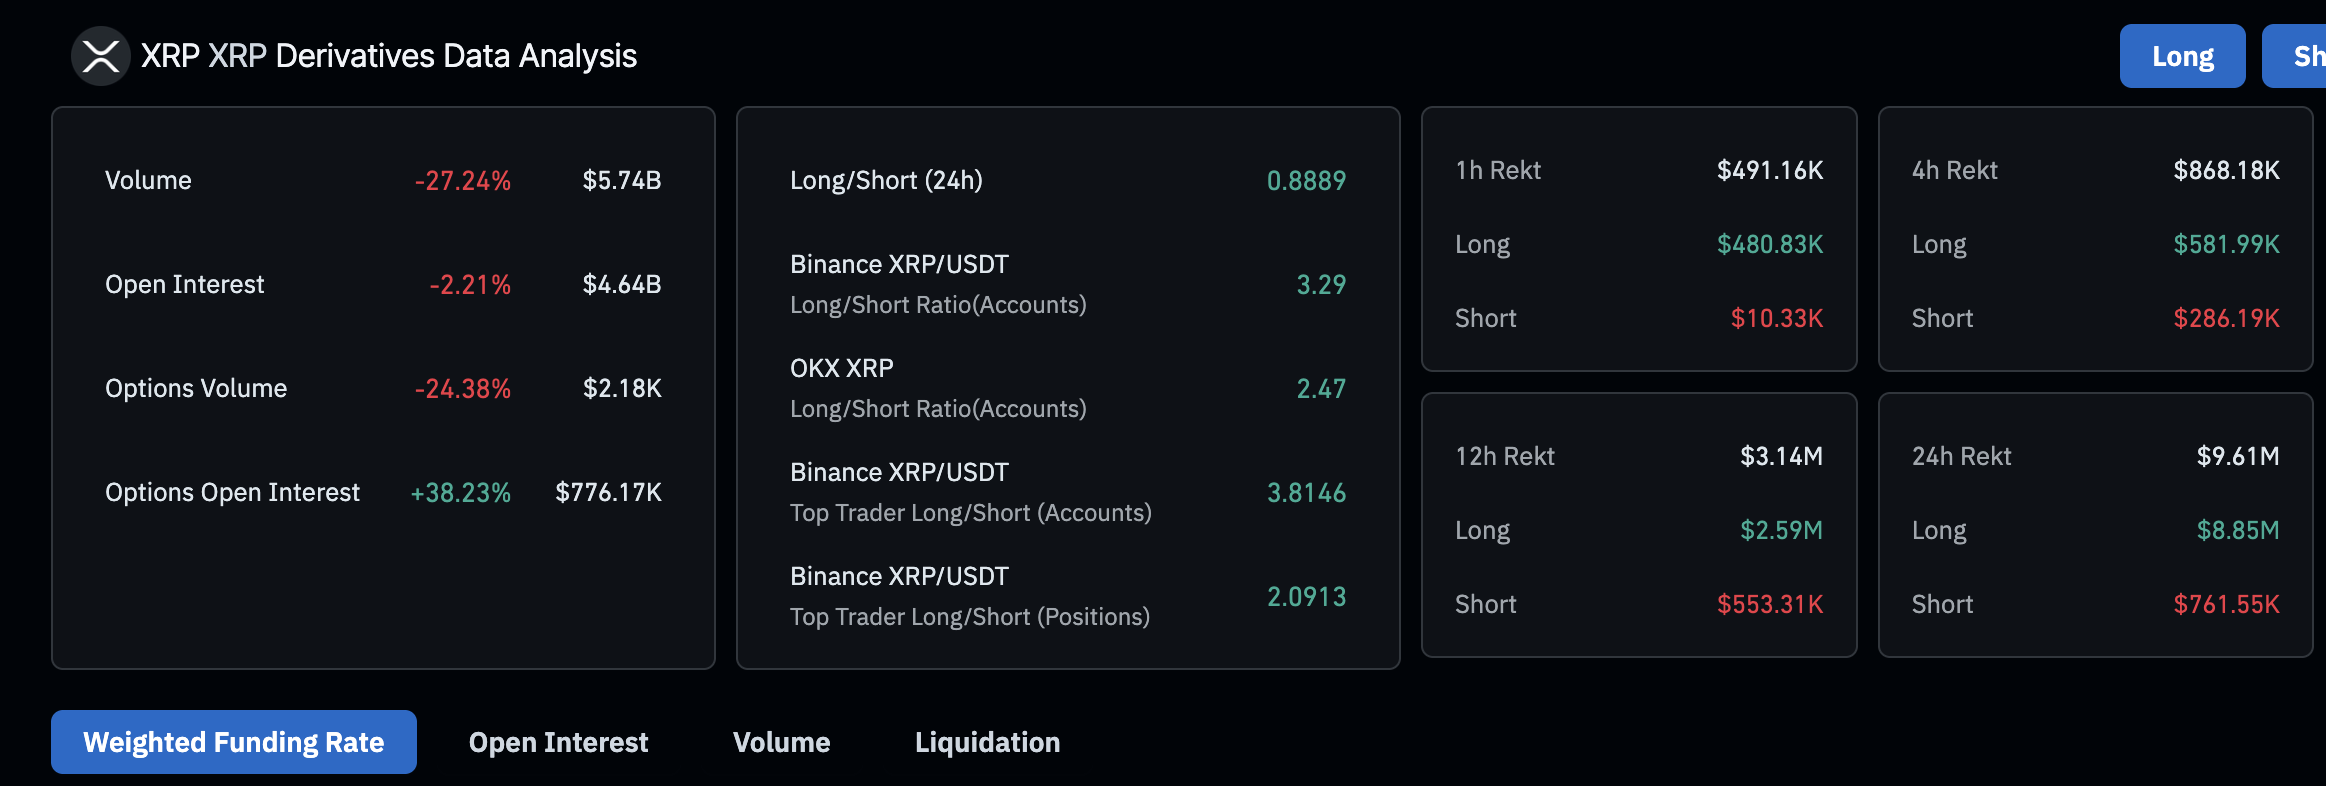
XRP derivatives data | Source: CoinGlass
Long positions liquidation reached $8.85 million in the last 24 hours compared to approximately $762,000 in shorts. A total of $9.61 million has been wiped out, implying that the market is volatile, calling for caution among traders betting on a price increase to $3.00.


Leave a Reply