
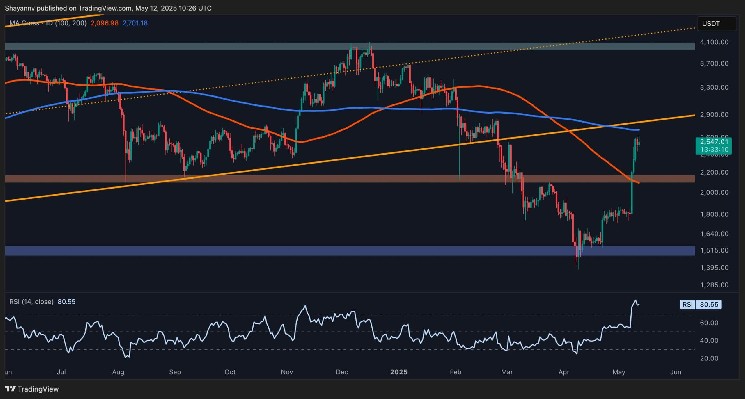
The Ethereum price today is trading near the $2,500 mark after staging an aggressive breakout from a multi-month downtrend. On the daily chart, ETH surged past the descending resistance line drawn from the December 2024 high, clearing key horizontal levels at $1,950 and $2,200. This Ethereum price spike follows a sharp impulse move that saw ETH rally from below $1,800 to nearly $2,550 in just a few sessions.
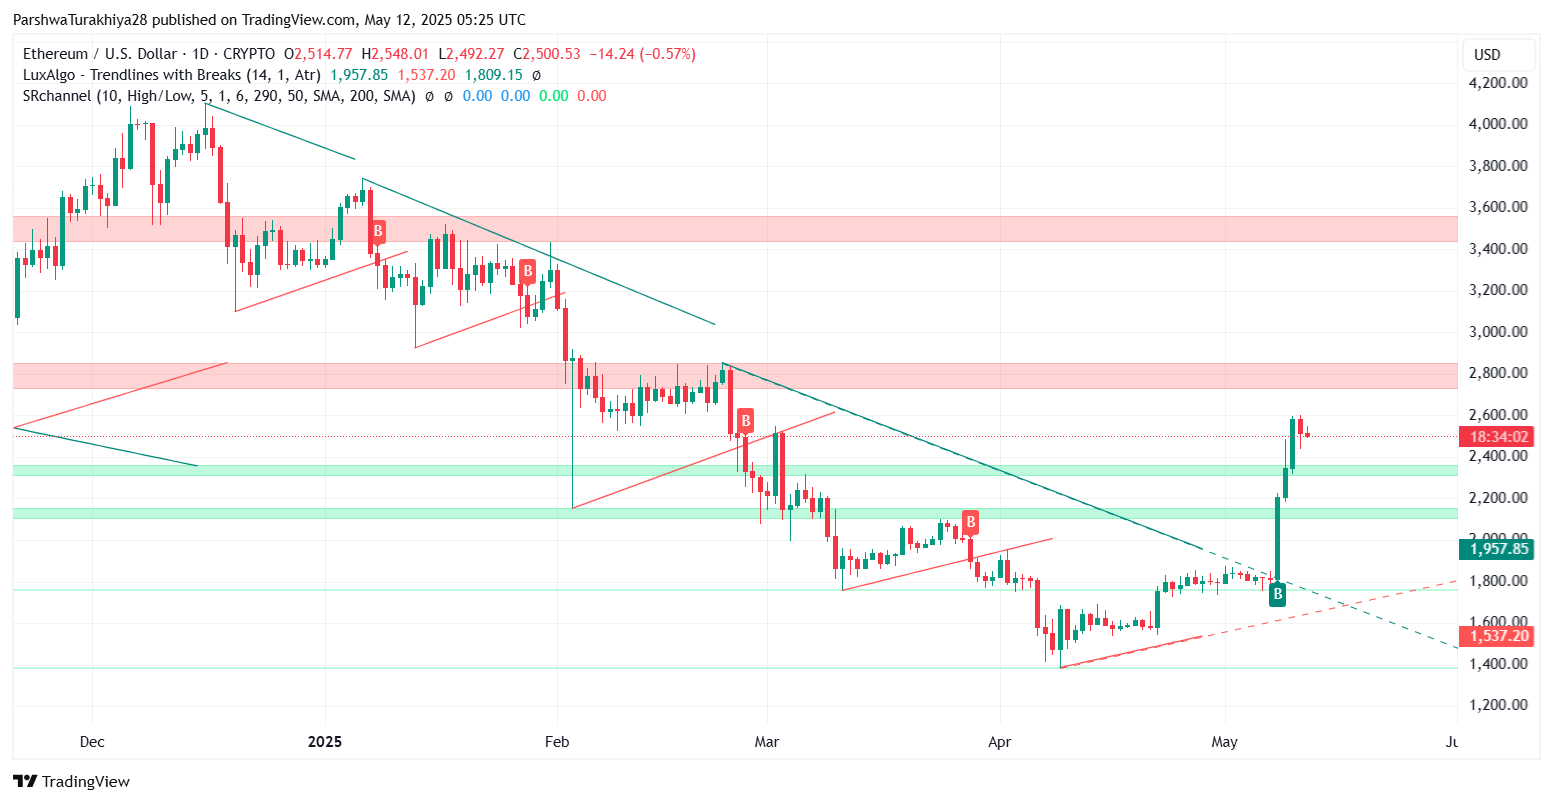
ETHUSD price dynamics (Source: TradingView)
This breakout also confirmed a long-awaited trend reversal, invalidating the previous bearish channel. The Ethereum price action shows strong buyer momentum, but as the price now hovers near a major resistance zone, traders are closely watching whether this rally can sustain into May 13.
Daily and Weekly Outlook: Ethereum Breaks Structure, But Faces Overhead Hurdles
On the 1D chart, the Ethereum price has successfully broken out of the falling wedge that contained it for most of Q1 2025. This breakout has brought ETH into a significant supply zone between $2,500 and $2,600—an area that previously marked the March breakdown. If bulls manage a daily close above $2,550, the next upside targets lie near $2,750 and the psychological $3,000 level.
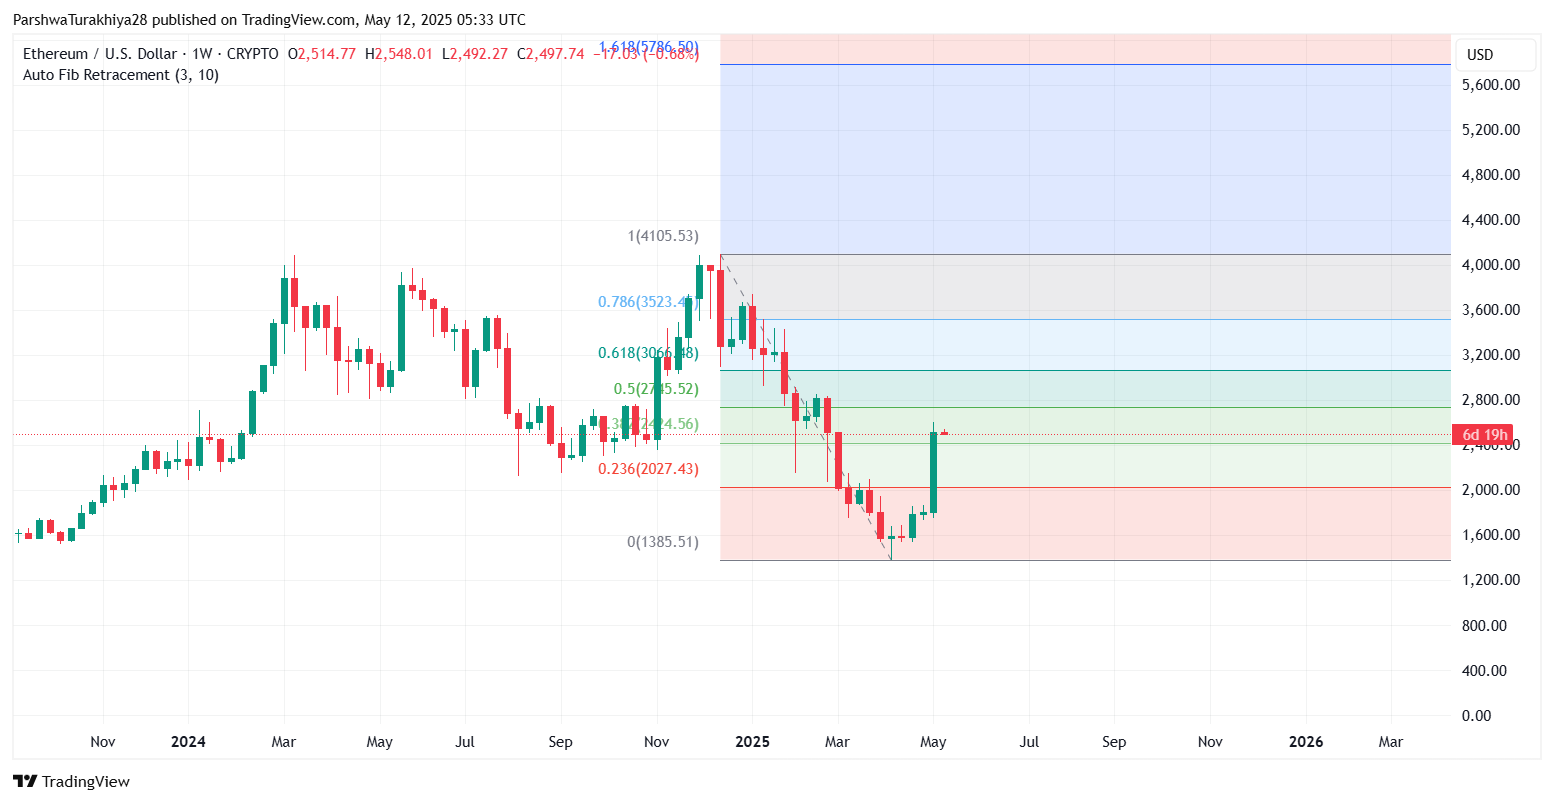
ETHUSD price dynamics (Source: TradingView)
Zooming out to the weekly chart, Fibonacci retracement levels from the $4,105 peak to the $1,385 low show that ETH is testing the 0.382 Fib at $2,445, with the 0.5 and 0.618 retracement zones at $2,755 and $3,066 respectively. This aligns with long-term resistance and suggests that a deeper pullback may occur before another leg higher.
Short-Term Ethereum Price Action: Is a Pullback Looming?
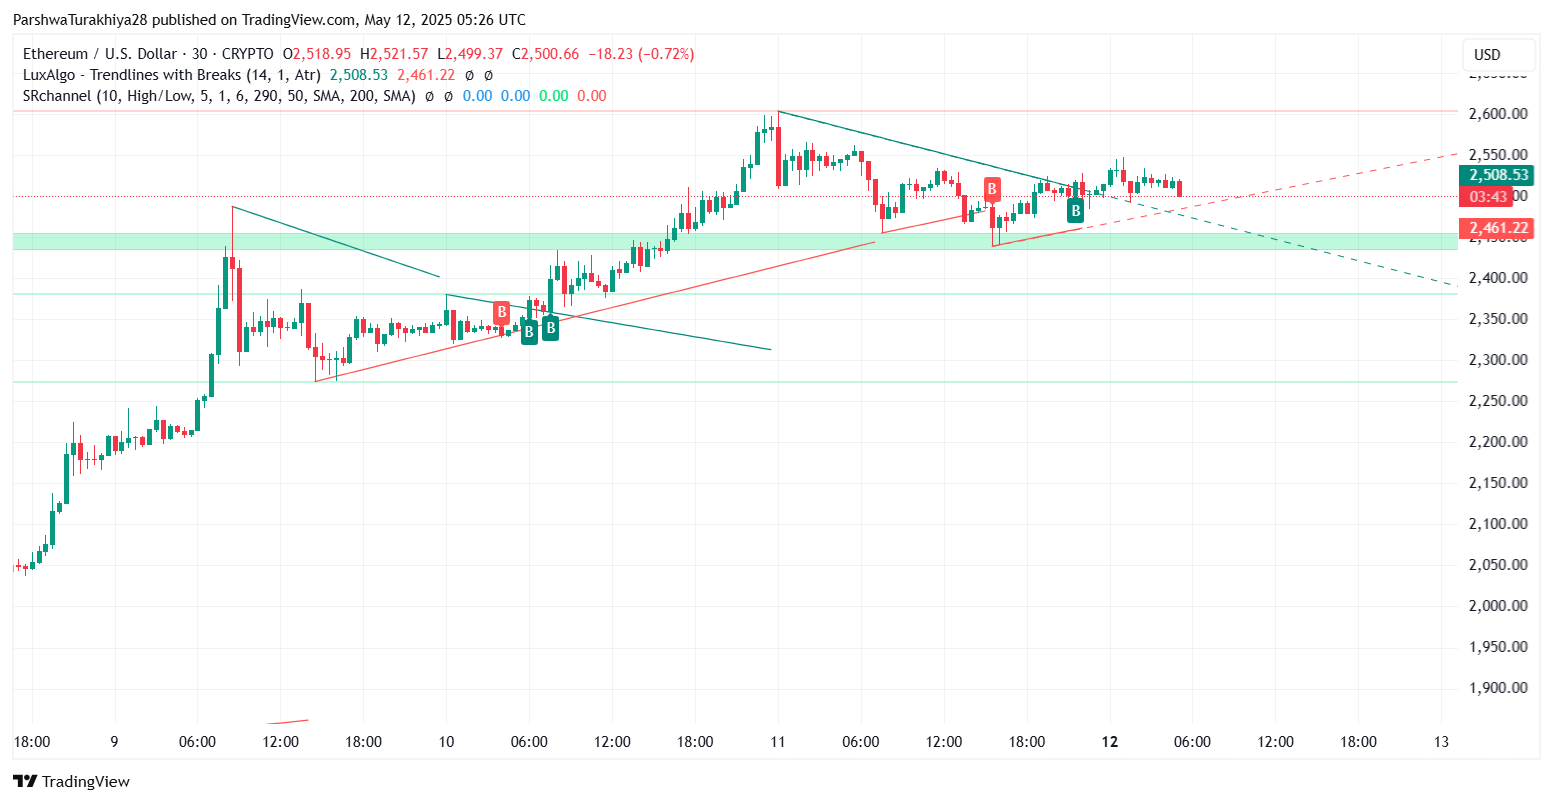
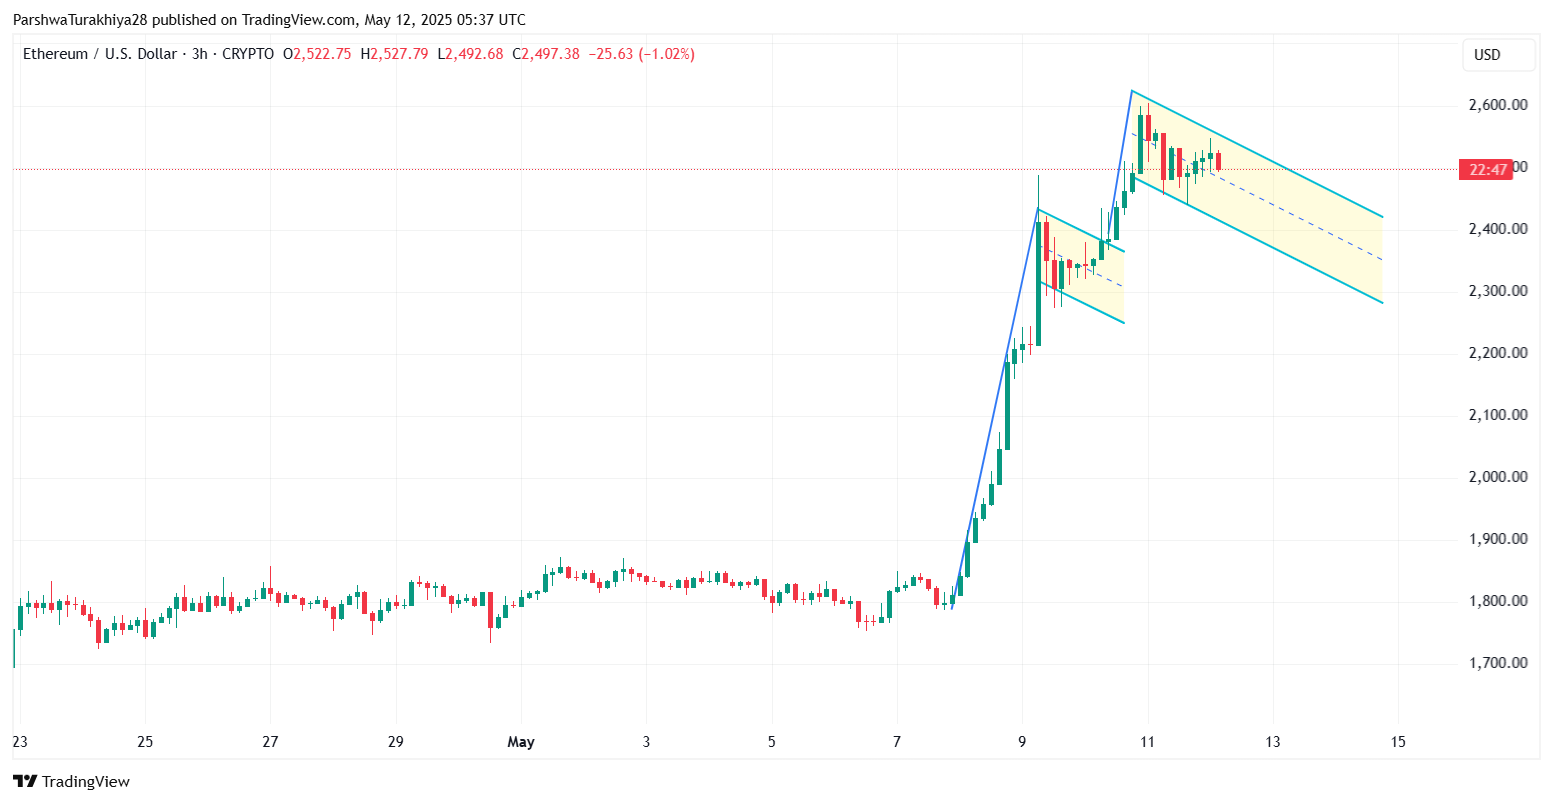
On lower timeframes like the 3-hour and 30-minute charts, the Ethereum price volatility is showing early signs of fatigue. After the vertical move, ETH has formed a descending parallel channel—often interpreted as a bullish continuation pattern. However, price is still trading within this range, and confirmation is required for breakout strength.
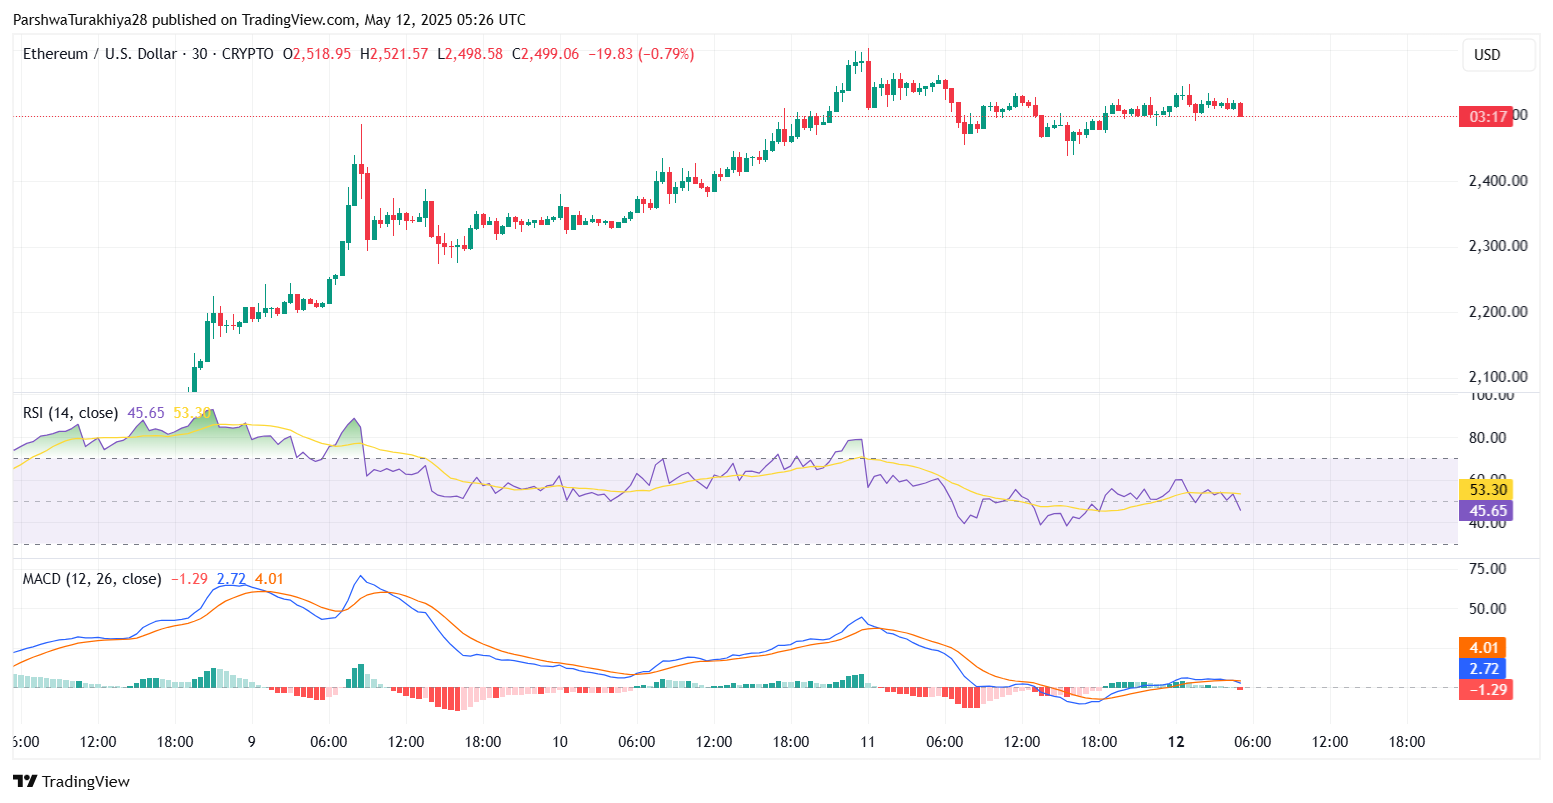
ETHUSD price dynamics (Source: TradingView)
The RSI on the 30-minute chart has dropped to 45, suggesting waning momentum. MACD shows a flattening of the histogram and a nearing bearish crossover. Meanwhile, Bollinger Bands on the 4-hour chart have narrowed after a wide expansion, hinting at reduced volatility and potential consolidation.
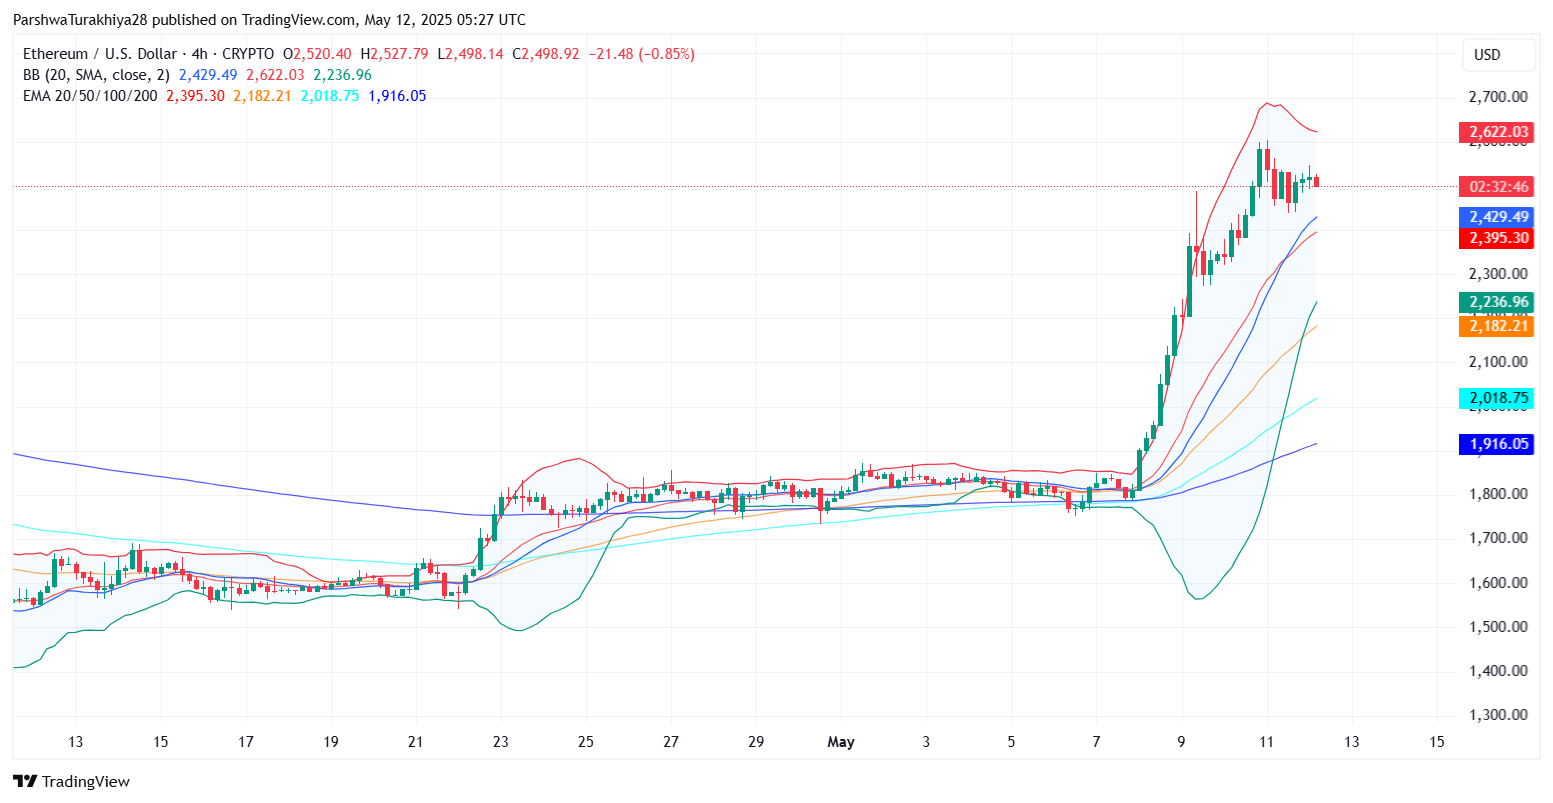
ETHUSD price dynamics (Source: TradingView)
On the 4-hour chart, the Ethereum price is still holding above key EMAs — the 20, 50, 100, and 200 — which reinforces bullish market structure. In particular, the 20-EMA and 50-EMA (near $2,395 and $2,182) may act as dynamic support zones if selling pressure increases.
Why Ethereum Price Going Down Today?
ETHUSD price dynamics (Source: TradingView)
Despite the overall bullish sentiment, Ethereum price today is facing short-term pressure due to profit-taking after the rapid ascent. The Stochastic RSI has dropped into oversold territory on the 4-hour chart, while momentum indicators are cooling down. This retracement is natural after such a sharp move and doesn’t yet signal a trend reversal.
If buyers defend the $2,450–$2,480 region and break above the $2,560 resistance, the Ethereum price could resume its uptrend. However, failure to hold the current level might lead to a short-term retrace back toward $2,395 or even the previous breakout point at $2,180.
Ethereum Price Prediction for May 13: Key Levels to Watch
ETHUSD price dynamics (Source: TradingView)
Heading into May 13, ETH remains in a bullish structure but may undergo a brief consolidation phase. The descending channel on the 3-hour chart needs to break to the upside for renewed momentum. A clean break above $2,560 opens up a path toward $2,750 and $2,900. On the flip side, losing $2,395 could accelerate a drop toward $2,180.
Forecast Table: Ethereum (ETH) Key Price Levels
The Ethereum price update suggests that while momentum has slowed after a vertical run, the bullish structure remains intact. As long as ETH holds above $2,395–$2,450, the rally could extend toward $2,750 or higher. However, traders should watch for any breakdown below $2,180 that could challenge the recent breakout narrative. Stay tuned for further coverage on whether this bullish reversal holds or gives way to renewed Ethereum price volatility.
Disclaimer: The information presented in this article is for informational and educational purposes only. The article does not constitute financial advice or advice of any kind. Coin Edition is not responsible for any losses incurred as a result of the utilization of content, products, or services mentioned. Readers are advised to exercise caution before taking any action related to the company.


Leave a Reply