Ethereum has experienced a notable surge in the past few weeks, reaching a crucial resistance region at the $2.6K level. However, the confluence of key resistance factors at this range suggests a likely consolidation before the next major move.
Technical Analysis
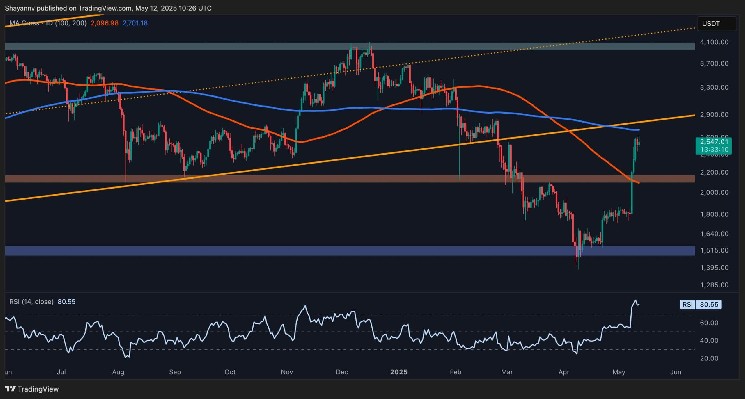
The Daily Chart
ETH has been in a strong and impulsive uptrend, reflecting a clear return of demand and buying strength in the market. The price has now reached a critical resistance zone near $2.6K, which aligns with both the 200-day moving average and the previously broken lower boundary of a multi-month ascending channel.
This confluence forms a strong resistance cluster, suggesting potential supply at this level and posing a significant challenge to further upward movement.
As a result, a temporary consolidation or corrective phase appears necessary for the market to stabilize and gather enough momentum for a potential breakout. The RSI indicator has also entered overbought territory, reinforcing the likelihood of a short-term correction.
The 4-Hour Chart
On the lower timeframe, Ethereum’s aggressive buying momentum has driven the price through several resistance levels. This rally signals the buyers’ intention to target all-time highs in the coming months. However, ETH has now reached a key supply zone of around $2.6K, which corresponds with a major swing high in March. This area has already capped the rally, suggesting a potential short-term pause or consolidation.
While a quick breakout above this resistance is still possible, the overbought RSI levels make a brief correction or sideways movement within this range, which is the more probable near-term scenario.
Onchain Analysis
By ShayanMarkets
The funding rates metric is a key indicator of sentiment in the futures market. Analyzing its recent behaviour offers valuable insight into Ethereum’s latest surge. In healthy and sustainable bullish trends, funding rates typically rise gradually, indicating increased participation from buyers in both the perpetual futures and spot markets.
Currently, however, funding rates remain relatively flat, showing no significant uptick. This suggests that Ethereum’s recent price surge has been primarily driven by spot market demand rather than speculative activity in the futures market. This is a bullish sign, as it implies the uptrend is organic and not fueled by excessive leverage, reducing the risk of liquidation cascades and indicating a more stable trend.
Still, for the bullish momentum to be sustained and validated, funding rates should begin to rise, reflecting increased confidence and more aggressive positioning by futures traders.


Leave a Reply