
Cardano (ADA) is turning heads again. After a prolonged consolidation phase, ADA is showing fresh signs of bullish momentum. The altcoin surged past a key resistance zone and is trading around $0.79 at the time of writing. With institutional interest growing in smart contract platforms and ADA’s strong fundamentals, many investors are watching closely to see if this could be the beginning of a larger trend. Let’s dive into the charts to uncover what’s next for Cardano.
Cardano Price Prediction: Bullish Breakout Brewing
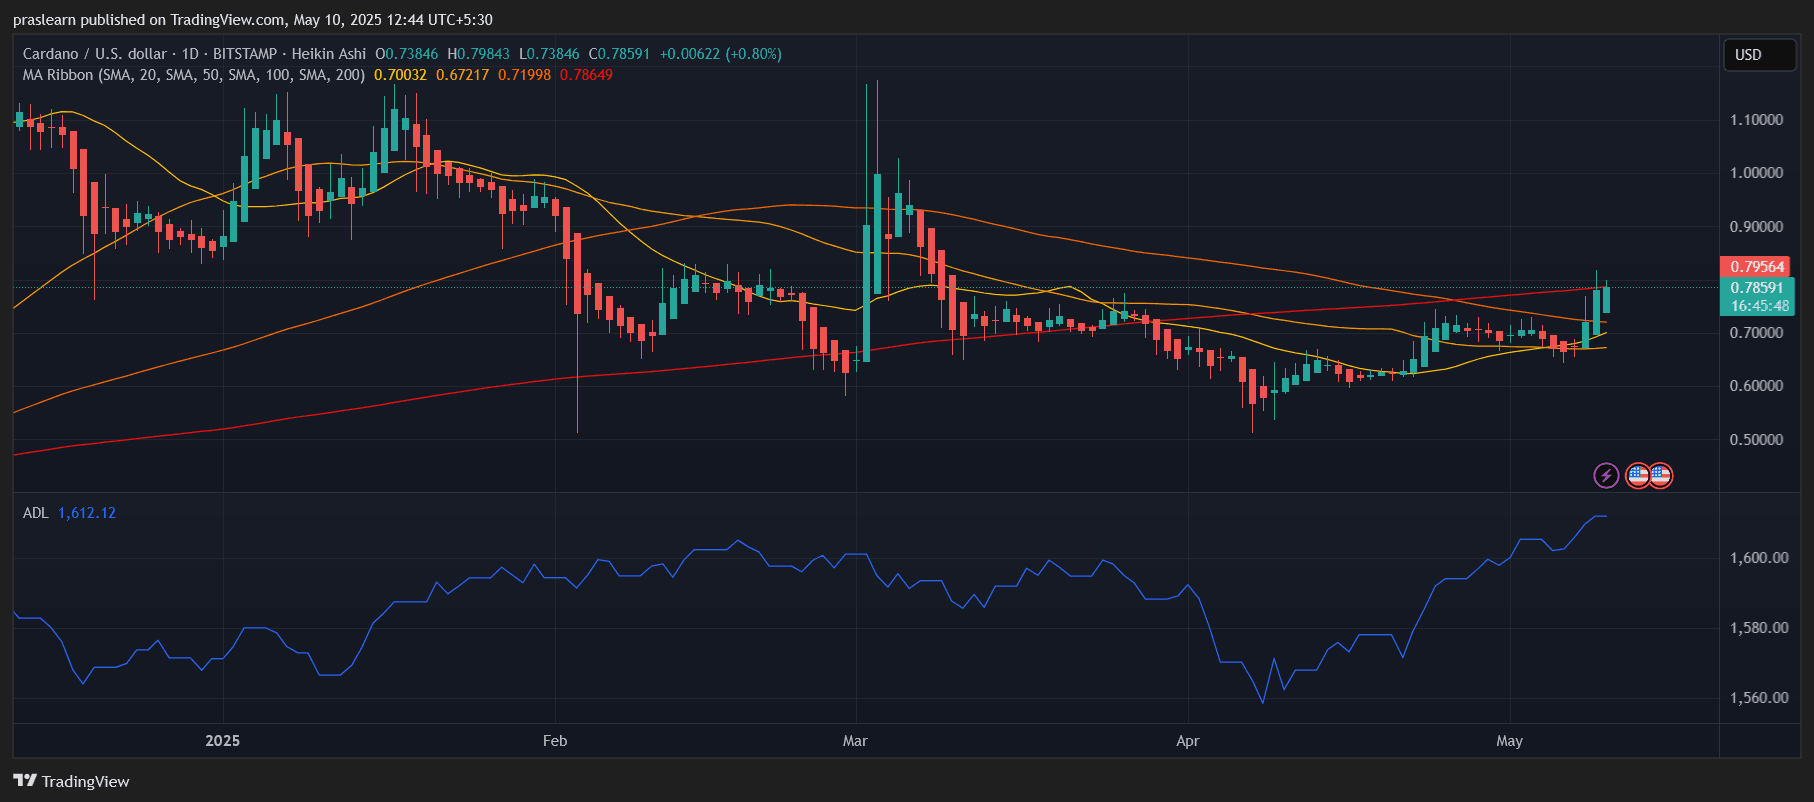
ADA/USD 1 Day Chart- TradingView
The daily chart presents a strong bullish development. ADA price has broken above its 50-day simple moving average (SMA), currently around $0.72, and is now eyeing a close above the 100-day SMA at $0.78. This is the first decisive move above the major moving averages in over two months. The recent candle shows a clear bullish engulfing pattern, coupled with higher volume and momentum, indicating strong buying pressure.
The ADL (Accumulation/Distribution Line) is sloping upward, confirming that accumulation is underway. The next significant resistance lies near the 200-day SMA at approximately $0.79–$0.80. A close above this level would trigger a broader breakout with potential targets toward $0.88 and $1.00 in the coming weeks.
Hourly Chart Insights: Momentum Gaining Traction
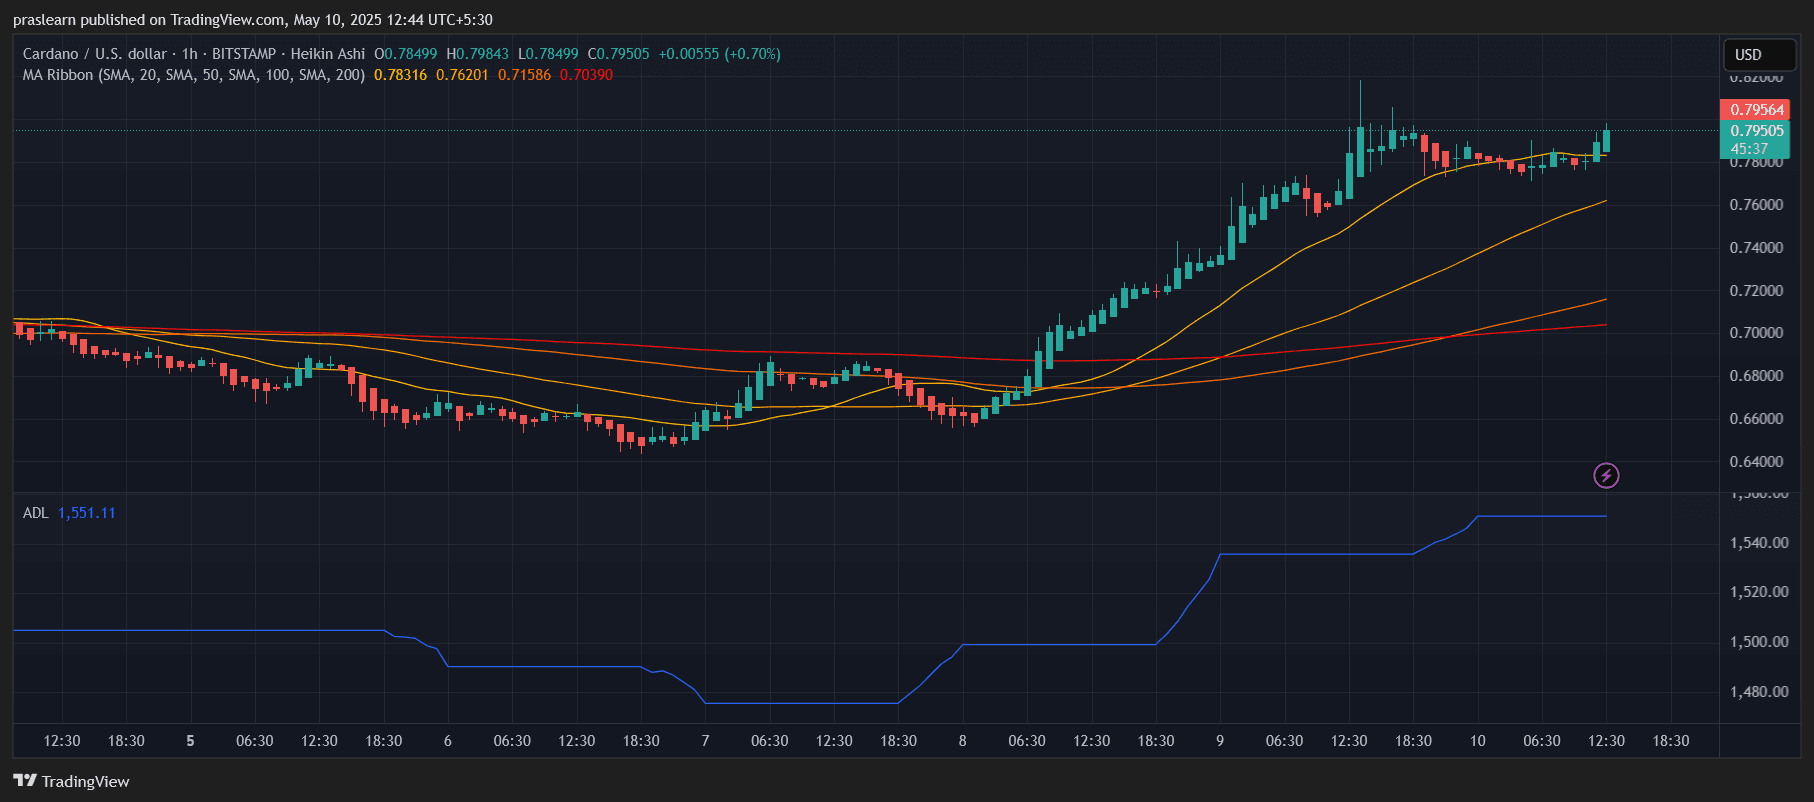
ADA/USD 1 Hr Chart- TradingView
Zooming into the hourly chart, ADA price is riding a strong uptrend that began around the $0.70 mark. The price action is consistently making higher highs and higher lows, a classic bullish structure. The ribbon of moving averages is aligned in bullish order — the 20, 50, and 100 SMAs are all stacked above the 200 SMA.
The most recent hourly candles show a minor consolidation just below $0.80, suggesting a potential flag or pennant formation, which typically leads to continuation. If ADA manages to flip $0.80 into support, intraday traders could see upside targets at $0.82 and $0.85 in the short term.
Cardano Price Prediction and Outlook
If Cardano price maintains momentum and closes above $0.80 on the daily time frame, it opens the door to test the $1.00 psychological level, which also aligns with prior structure resistance. The technicals suggest that the bullish trend may have just begun. On the downside, support lies around $0.74, followed by a stronger level near $0.70.
Conclusion
Cardano is displaying renewed bullish strength after months of sideways trading. Both the daily and hourly charts indicate a trend reversal backed by volume and moving average alignment. With broader crypto market optimism and Cardano’s increasing DeFi adoption, ADA could be gearing up for a strong rally. Traders should monitor $0.80 for a potential breakout confirmation and place stop-losses below $0.74 to manage risk.


Leave a Reply