
Litecoin, often dubbed the “silver to Bitcoin’s gold,” has seen a stealthy recovery in the past few weeks, climbing from the low $70s to nearly $86. While the broader crypto market remains cautious, LTC’s technical setup suggests that the coin might be preparing for a larger move. But can it really break $100 and rally beyond in May?
Let’s break down the daily and hourly charts and run some predictive numbers.
Litecoin Price Prediction: What the Indicators Are Saying?
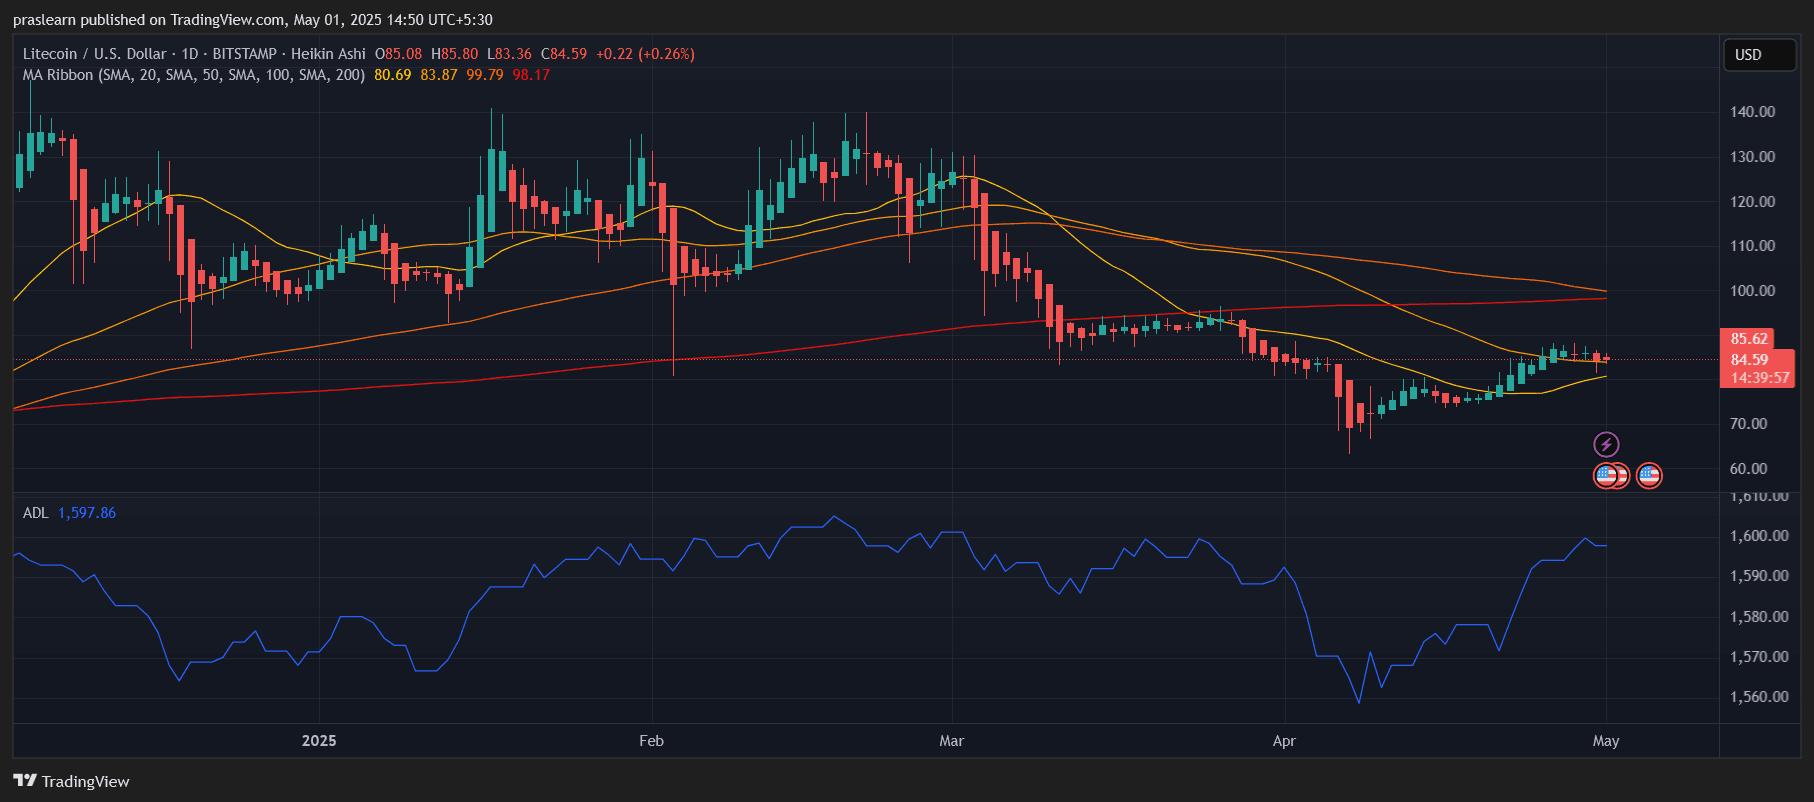
LTC/USD 1 Day Chart- TradingView
The daily chart paints a promising picture. LTC is trading above the 20-day and 50-day simple moving averages (SMA), currently hovering around $84.59. These levels now act as solid support. However, the coin is still facing resistance from the 100-day and 200-day SMAs, which are converging near $99.79 and $98.17 respectively. A breakout above these could trigger a strong bullish run.
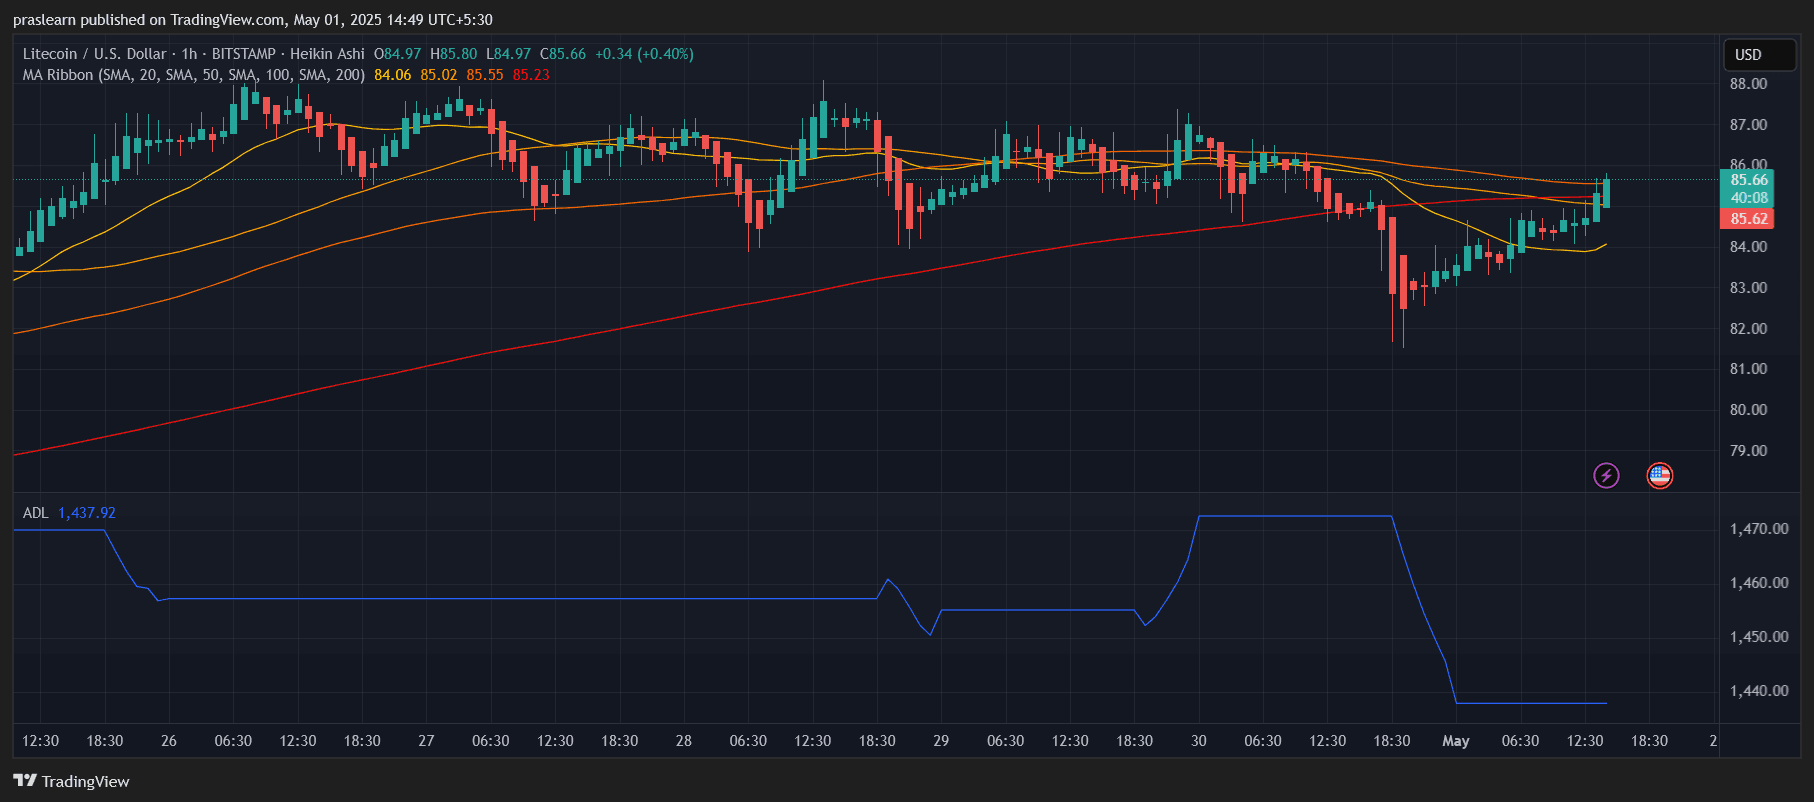
LTC/USD 1 Hr Chart- TradingView
Meanwhile, the hourly chart shows Litecoin price action tightening between the short-term moving averages, forming a classic consolidation range. As of May 1st, LTC just bounced from its hourly 200 SMA, hinting at growing buying interest.
The Accumulation/Distribution Line (ADL) on both charts has been trending upward — a strong signal that smart money is entering.
Is a Golden Cross Coming?
Looking at the MA ribbon, we’re getting close to a potential golden cross (where the 50-day SMA crosses above the 200-day SMA). Historically, this crossover has triggered 20–30% rallies for Litecoin in previous cycles.
If the current trajectory holds, and LTC closes above $90 within the next week, this could align the perfect storm for a bullish breakout.
Short-Term Price Projection (7–14 Days)
Given the current bullish structure and moving average support, the projected range for Litecoin in the next two weeks looks like this:
- Support Zone: $80 – $82
- Resistance Zone: $88 – $92
- Breakout Target: $97 – $102 (if $92 flips to support)
May 2025 Litecoin Price Prediction: Could LTC Hit $120?
If, breaks above $100, and sees even modest inflows, it could challenge $115–$120 in May. Historically, after breaking long-term resistance, LTC rallies between 20–35% within 30 days.
Hypothetical ROI:
If you invest $1,000 at $85 and LTC hits $120, you’re looking at:
- $1,000 / $85 = 11.76 LTC
- 11.76 LTC x $120 = $1,411
- Potential gain: +41%
Final Take: What Should Traders Watch?
Traders should closely watch for a volume confirmation above the $90 level, as a spike in buying interest could validate a potential breakout and shift momentum firmly in favor of the bulls. Another key technical event to monitor is the approaching golden cross — where the 50-day simple moving average (SMA) is on track to cross above the 200-day SMA.
This crossover is often seen as a strong bullish signal in traditional and crypto markets alike. Additionally, it would be wise to set alerts around the $88 and $100 price zones, as these represent immediate resistance levels. A successful flip of these levels into support could pave the way for a sustained rally. While Litecoin may not generate the same hype as meme coins, its underlying technical structure suggests that it’s preparing for a meaningful move. If market conditions remain favorable, May could very well be Litecoin’s breakout month.


Leave a Reply