XRP opened May 1, 2025, trading within a tight intraday range of $2.15 to $2.24, maintaining a current price of $2.22. With a total market capitalization of $130 billion and daily trading volume of $2.94 billion, XRP remains in a key consolidation phase with signals suggesting cautious optimism across multiple timeframes.
XRP
On the 1-hour chart, XRP exhibits a recovery trajectory following a sharp dip to $2.124, showing resilience with gradual upward price movement. Candlestick structures with lower wicks indicate consistent buying interest, while micro support is established at $2.20. Short-term resistance has formed around $2.25, where price action has seen repeated rejection. The preferred strategy in this timeframe involves entries between $2.20 and $2.22, contingent on bullish candle confirmation, targeting exits near $2.26 to $2.30. However, a decisive breakdown below $2.18 would nullify the bullish case for intraday traders.
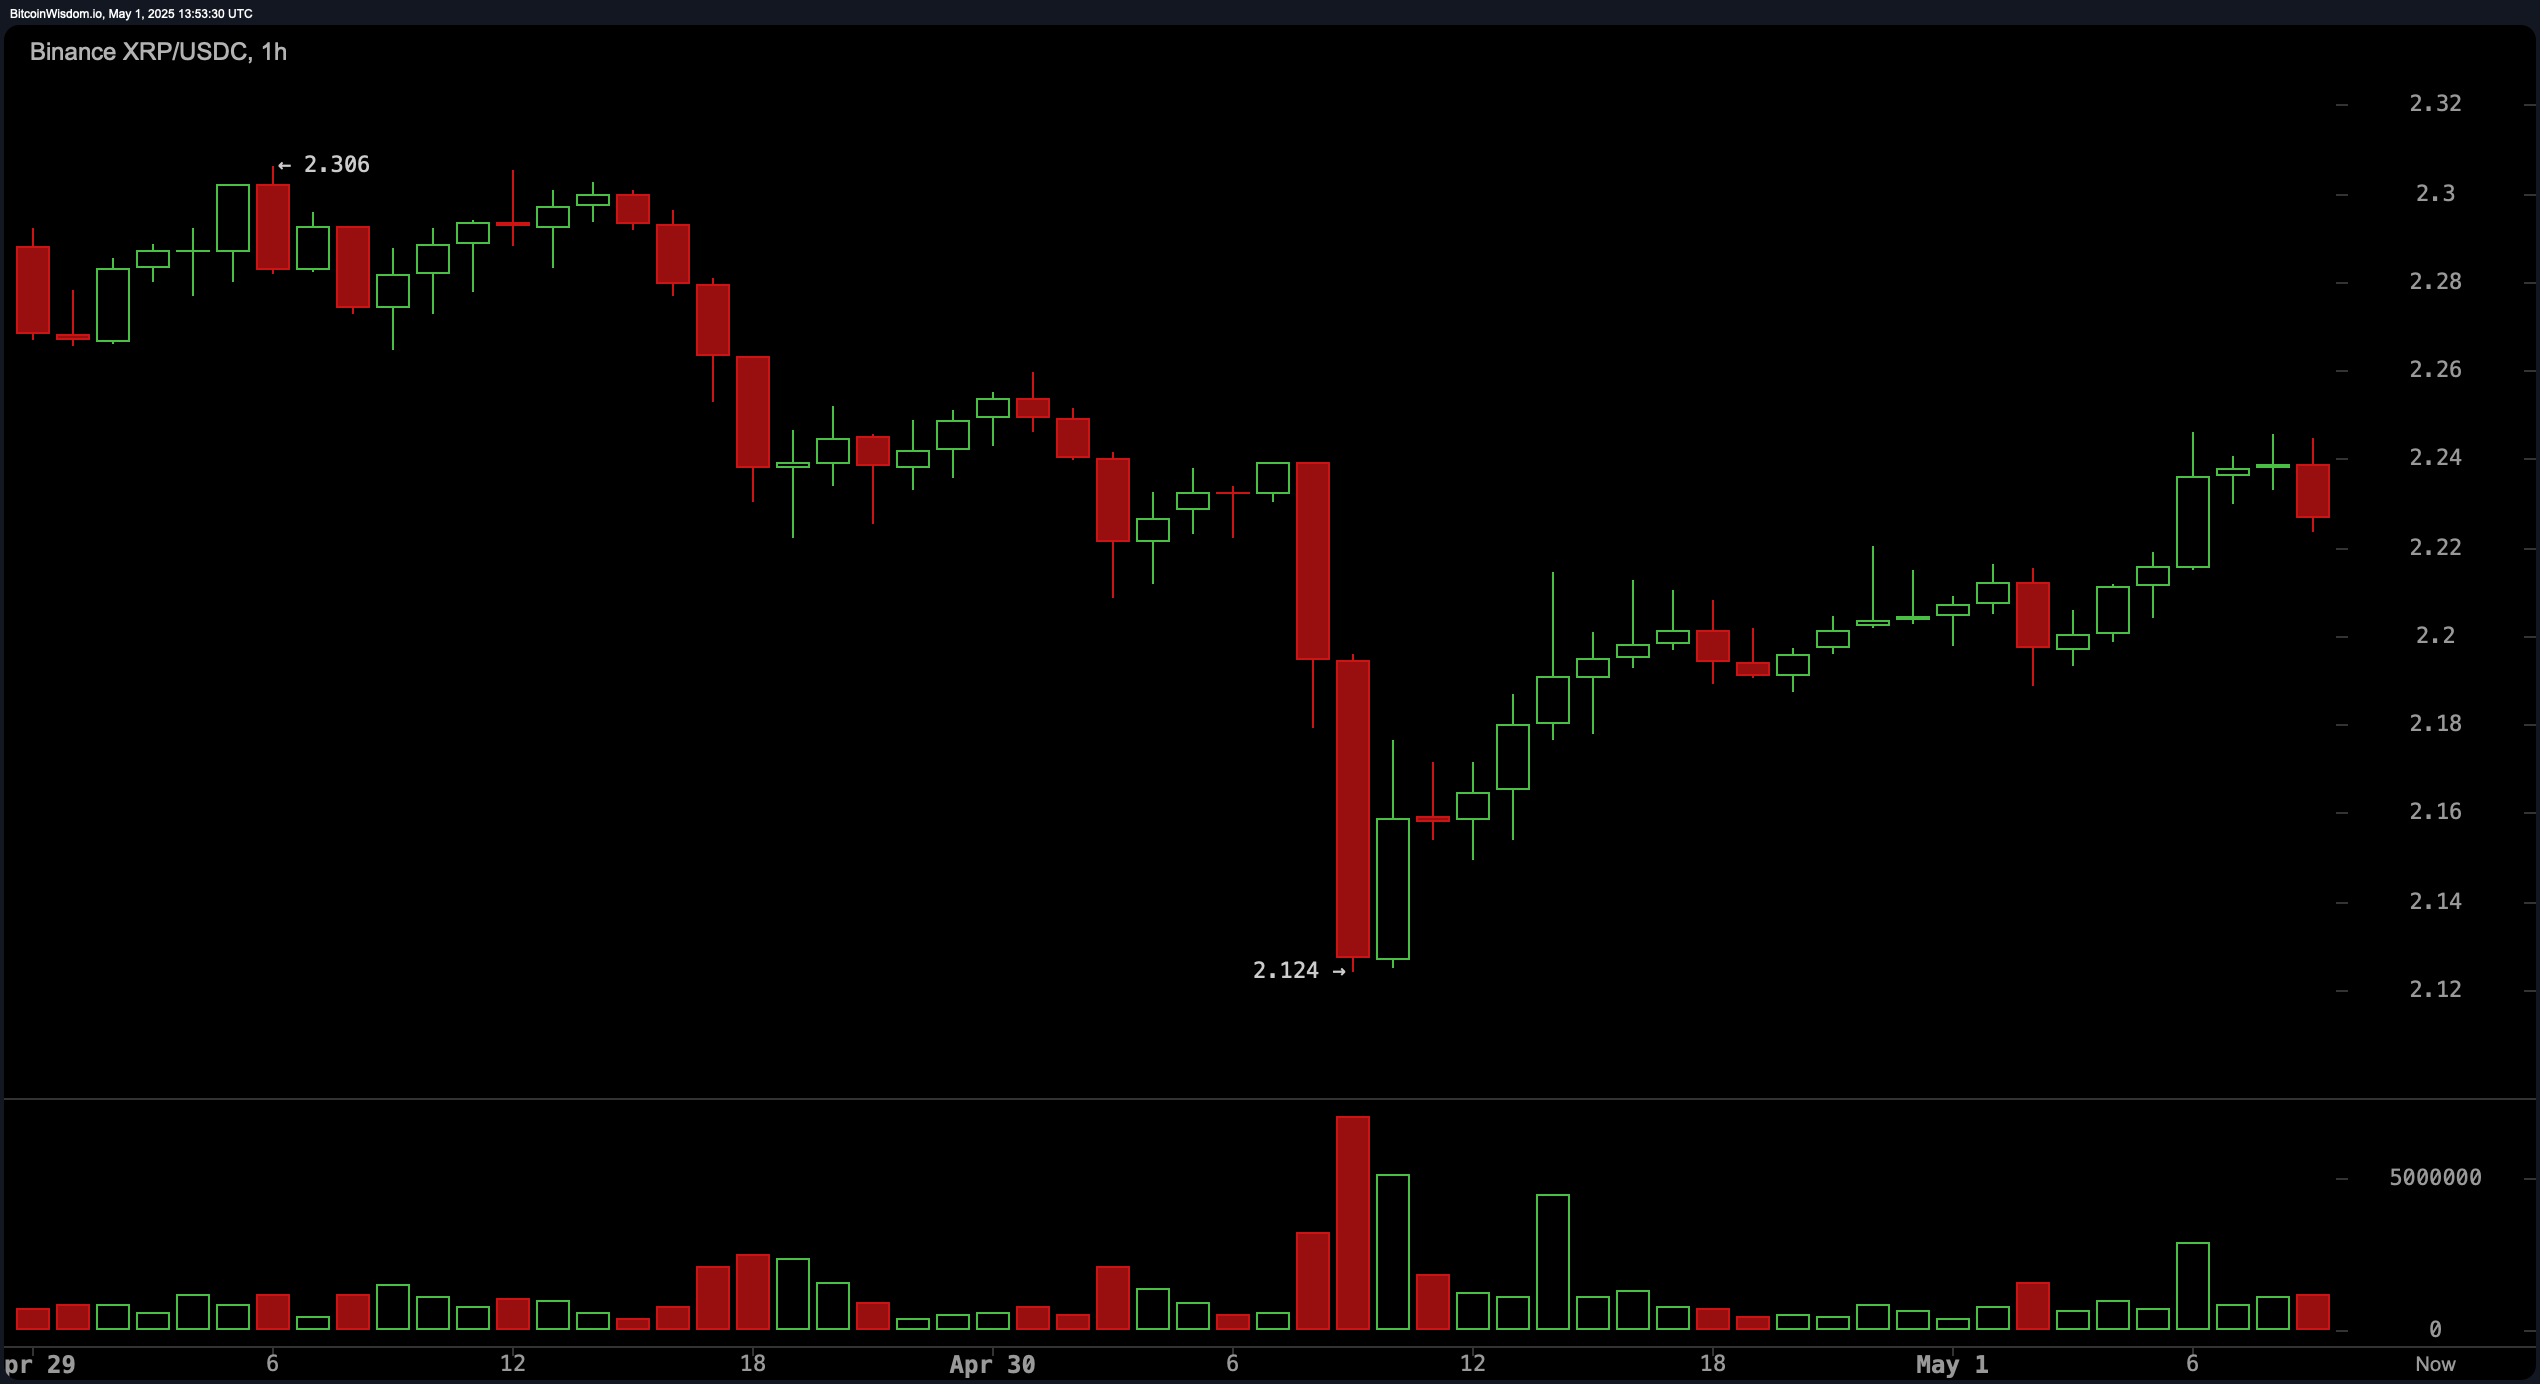
XRP/USDC 1H chart on May 1, 2025.
On the 4-hour chart, XRP is consolidating after a robust rally, creating a structure of higher lows and maintaining short-term support at $2.15. A notable volume spike around April 30 signals a classic shakeout, often indicative of a market clearing weak hands before a breakout. Resistance continues to cap price action in the $2.30 to $2.35 zone, a level that has repeatedly been tested but not decisively breached. Traders are closely monitoring this tightening consolidation, with potential entries near $2.20 to $2.22 and profit-taking advised near the $2.34 to $2.36 range, while keeping stop-loss orders just under $2.14.
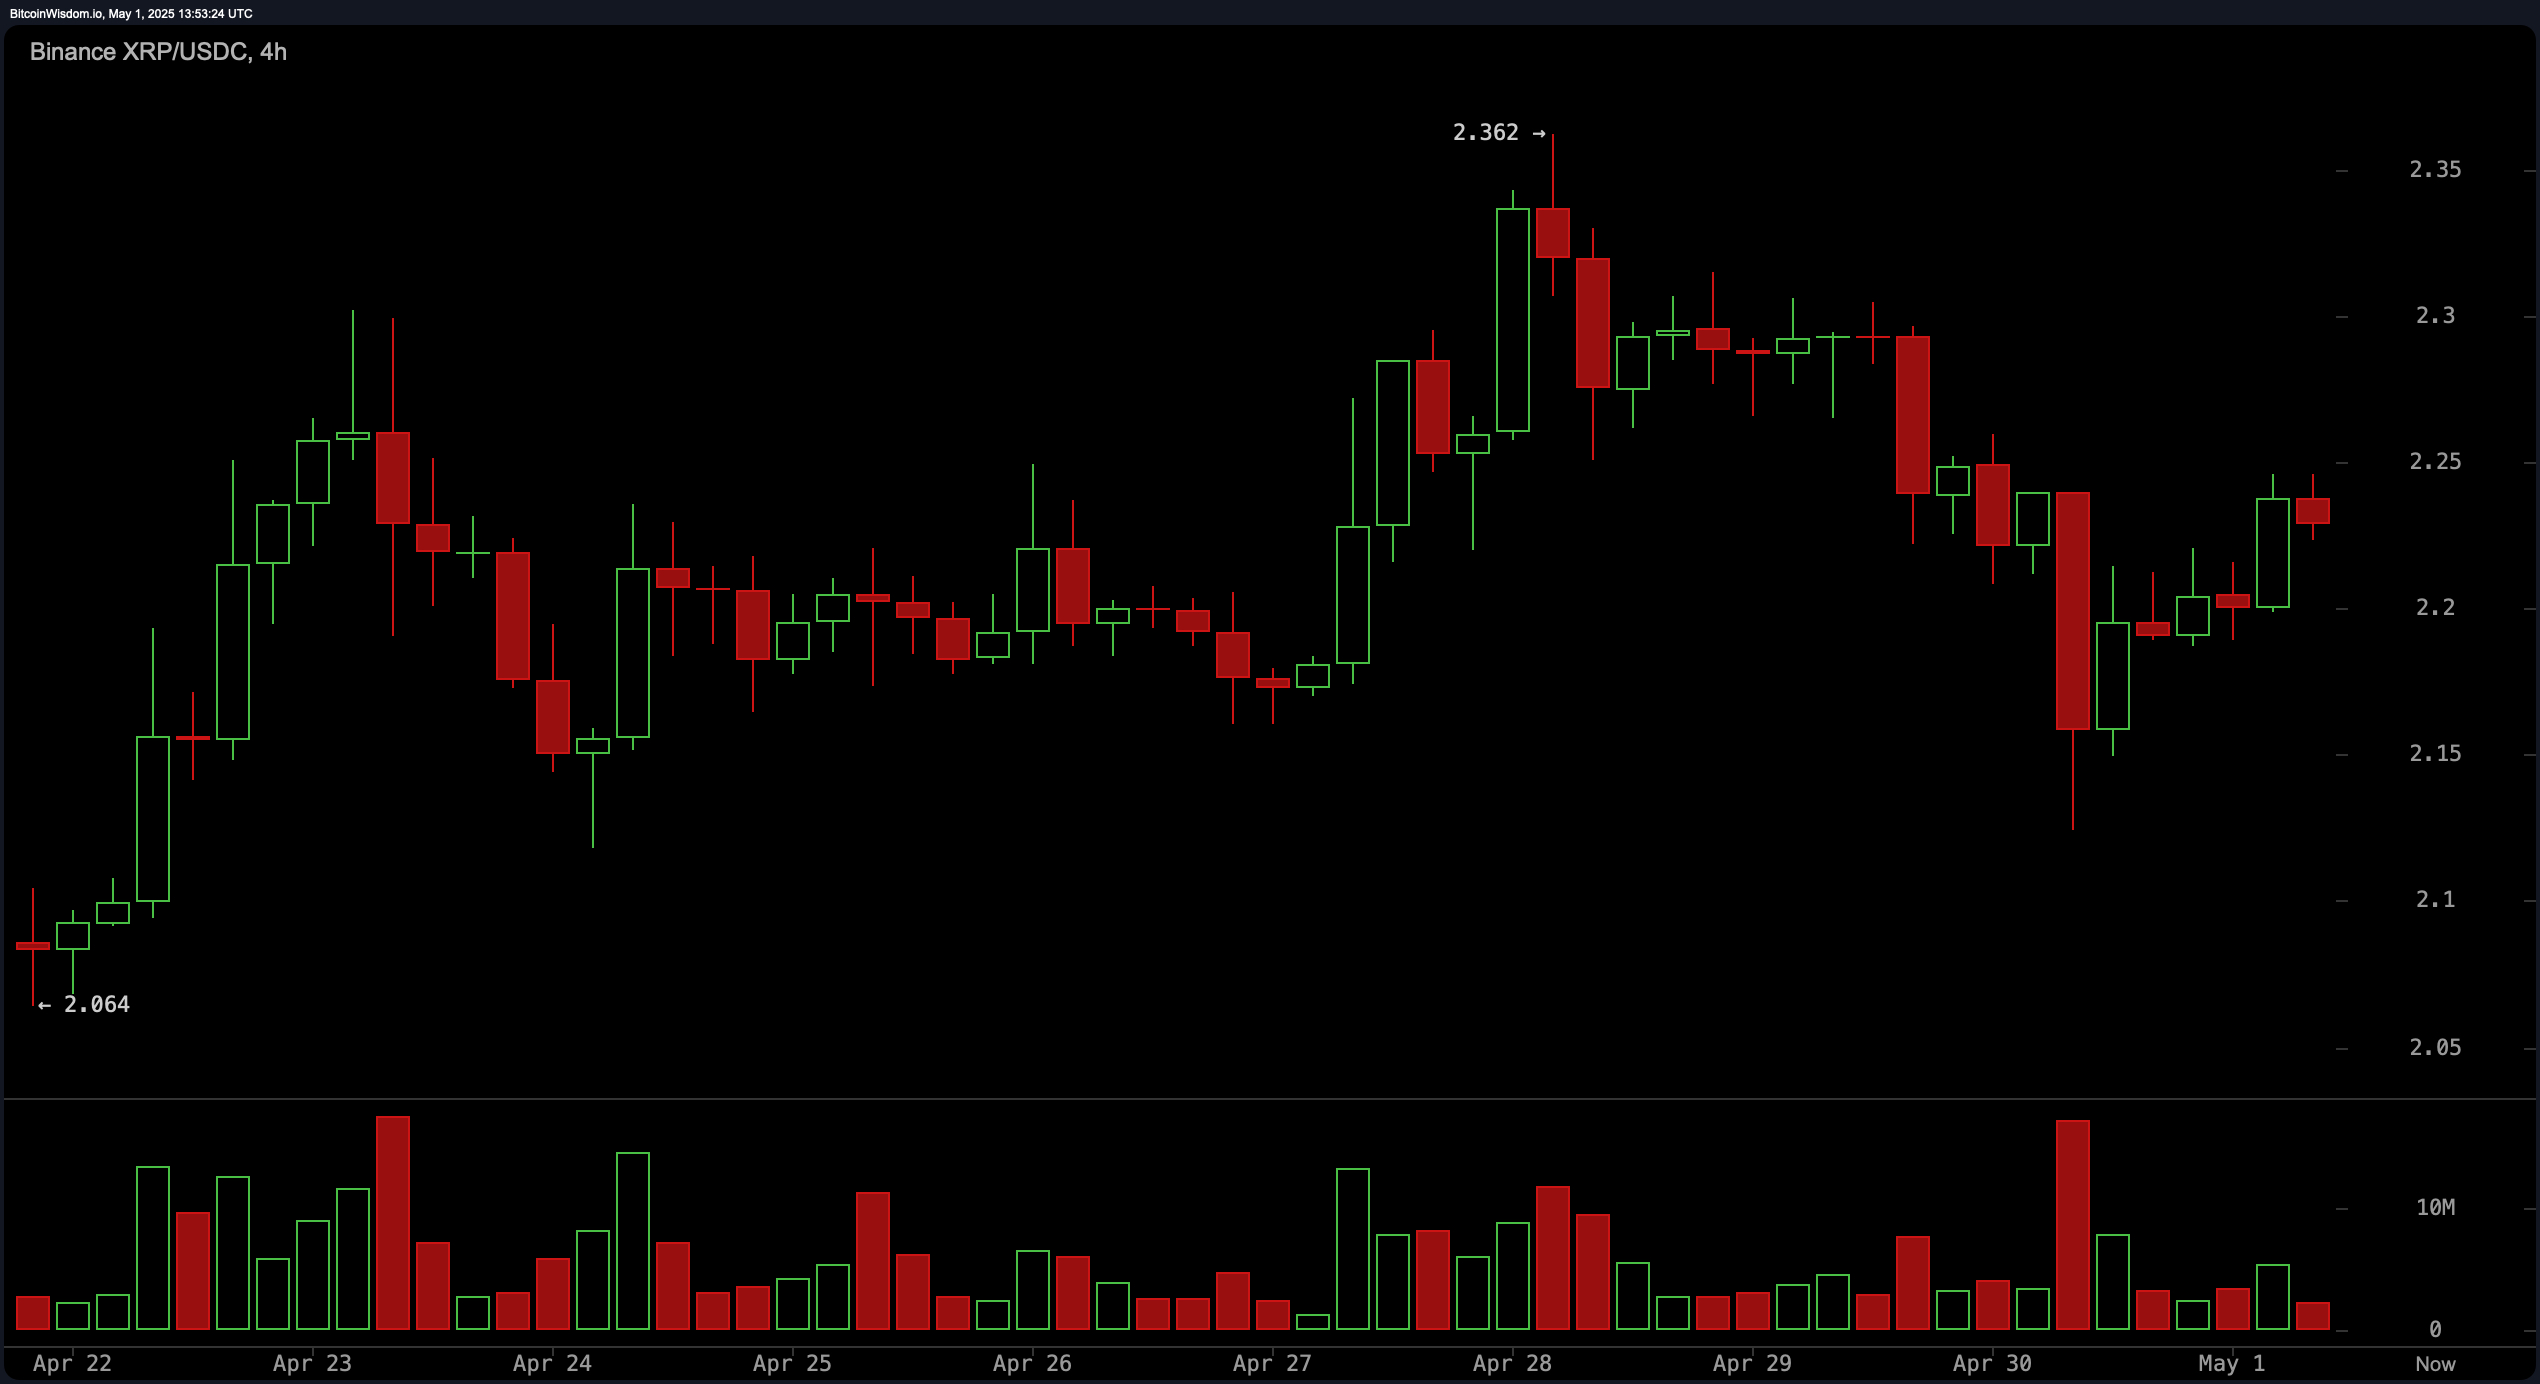
XRP/USDC 4H chart on May 1, 2025
The daily chart portrays a broader bullish recovery from a mid-April low of $1.611 to a recent local peak around $2.35. Although volume has tapered following the initial surge, this pattern suggests a constructive pullback rather than a breakdown. Strong horizontal support lies between $1.60 and $1.70, while resistance at $2.30 to $2.35 remains the primary barrier to further gains. Momentum is rebuilding, and market participants are evaluating entries near the $2.10 to $2.15 zone. A breakout above $2.35 could attract increased volume and bullish continuation toward new highs.
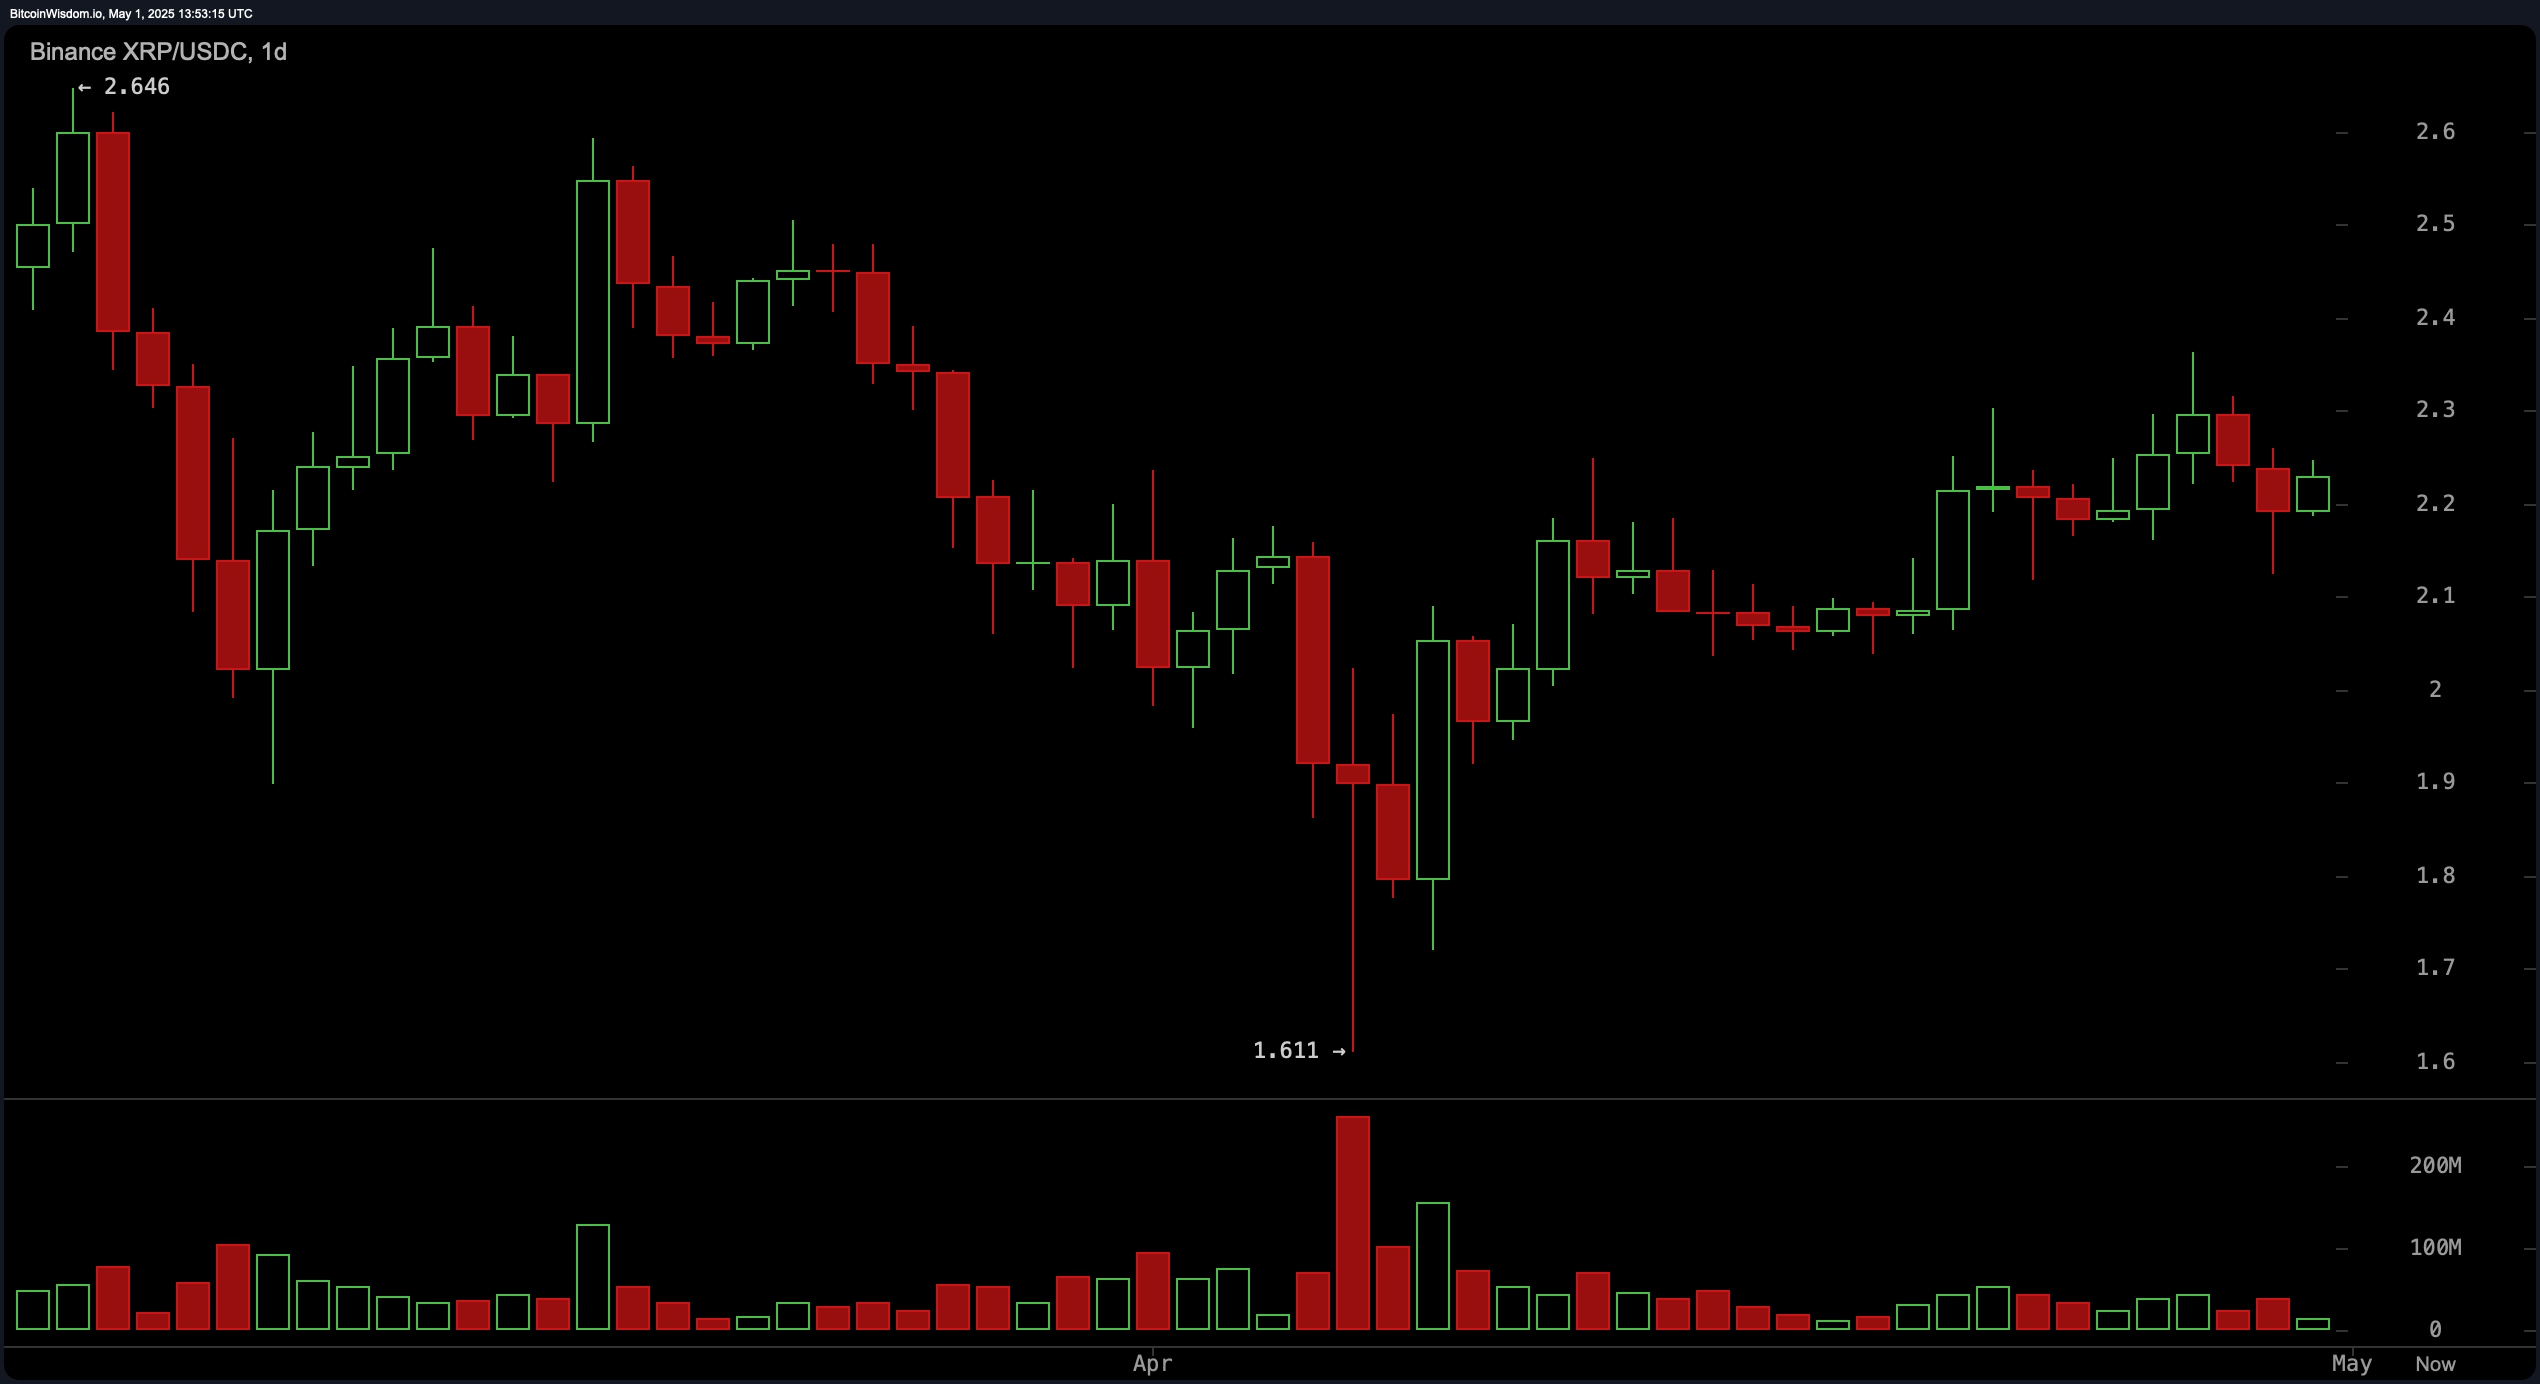
XRP/USDC 1D chart on May 1, 2025
XRP’s oscillators offer a neutral-to-positive outlook, with the relative strength index (RSI) at 54.24 indicating neither overbought nor oversold conditions. The Stochastic oscillator at 55.68 and the commodity channel index (CCI) at 67.05 also point to neutral sentiment, aligning with a consolidative market. The average directional index (ADX) at 13.49 suggests a lack of strong directional trend, while the Awesome oscillator at 0.13 and momentum indicator at 0.14 lean toward a mild bullish bias. Notably, the moving average convergence divergence (MACD) level at 0.02462 signals positivity, reinforcing the potential for an upside breakout.
The outlook from XRP’s moving averages is predominantly bullish. The exponential moving average (EMA) and simple moving average (SMA) across 10-, 20-, 30-, 50-, 100-, and 200-periods show widespread bullish signals, except for the simple moving average (SMA) at the 100-period, which indicates negativity at $2.38965. Prices remain above most key averages, with the exponential moving average (EMA) for the 100-period near $2.22 aligning closely with current prices. This convergence underscores market equilibrium and may act as dynamic support. As long as XRP holds above the $2.20 threshold and continues forming higher lows, the broader technical structure supports a moderately bullish bias.
Bull Verdict:
If XRP maintains its position above key support zones around $2.15–$2.20 and breaks through the $2.30–$2.35 resistance with conviction, the technical structure supports a continuation of the bullish trend. Buy signals across most moving averages and a supportive momentum profile hint at the potential for a move toward new 2025 highs above $2.35.
Bear Verdict:
Should XRP fail to hold the $2.15 support and breach the $2.14 stop-loss threshold, especially amid weakening volume and neutral oscillators, the setup could shift bearish. A breakdown below $2.10 would invalidate the bullish case and open the door to a potential retest of the $1.70–$1.60 support range.


Leave a Reply