
Bitcoin trades just around the key psychological resistance at $95,000 as bullish momentum continues to build following a resilient recovery phase marked by consolidation and declining intraday volume.
Bitcoin
On the daily chart, bitcoin shows signs of a V-shaped recovery, rebounding sharply from a local bottom of approximately $74,434 after a steep decline from $100,185. The price has since been consolidating just under the critical $95,000 level, indicating healthy accumulation. Volume increased notably during the recent rally, reflecting strong buyer interest. Support levels are currently observed at $85,000 and $74,400, while resistance lies between $95,000 and $100,000. A break above $95,000 with confirming volume could reignite bullish sentiment targeting a return to all-time highs, though caution is advised near the upper resistance.
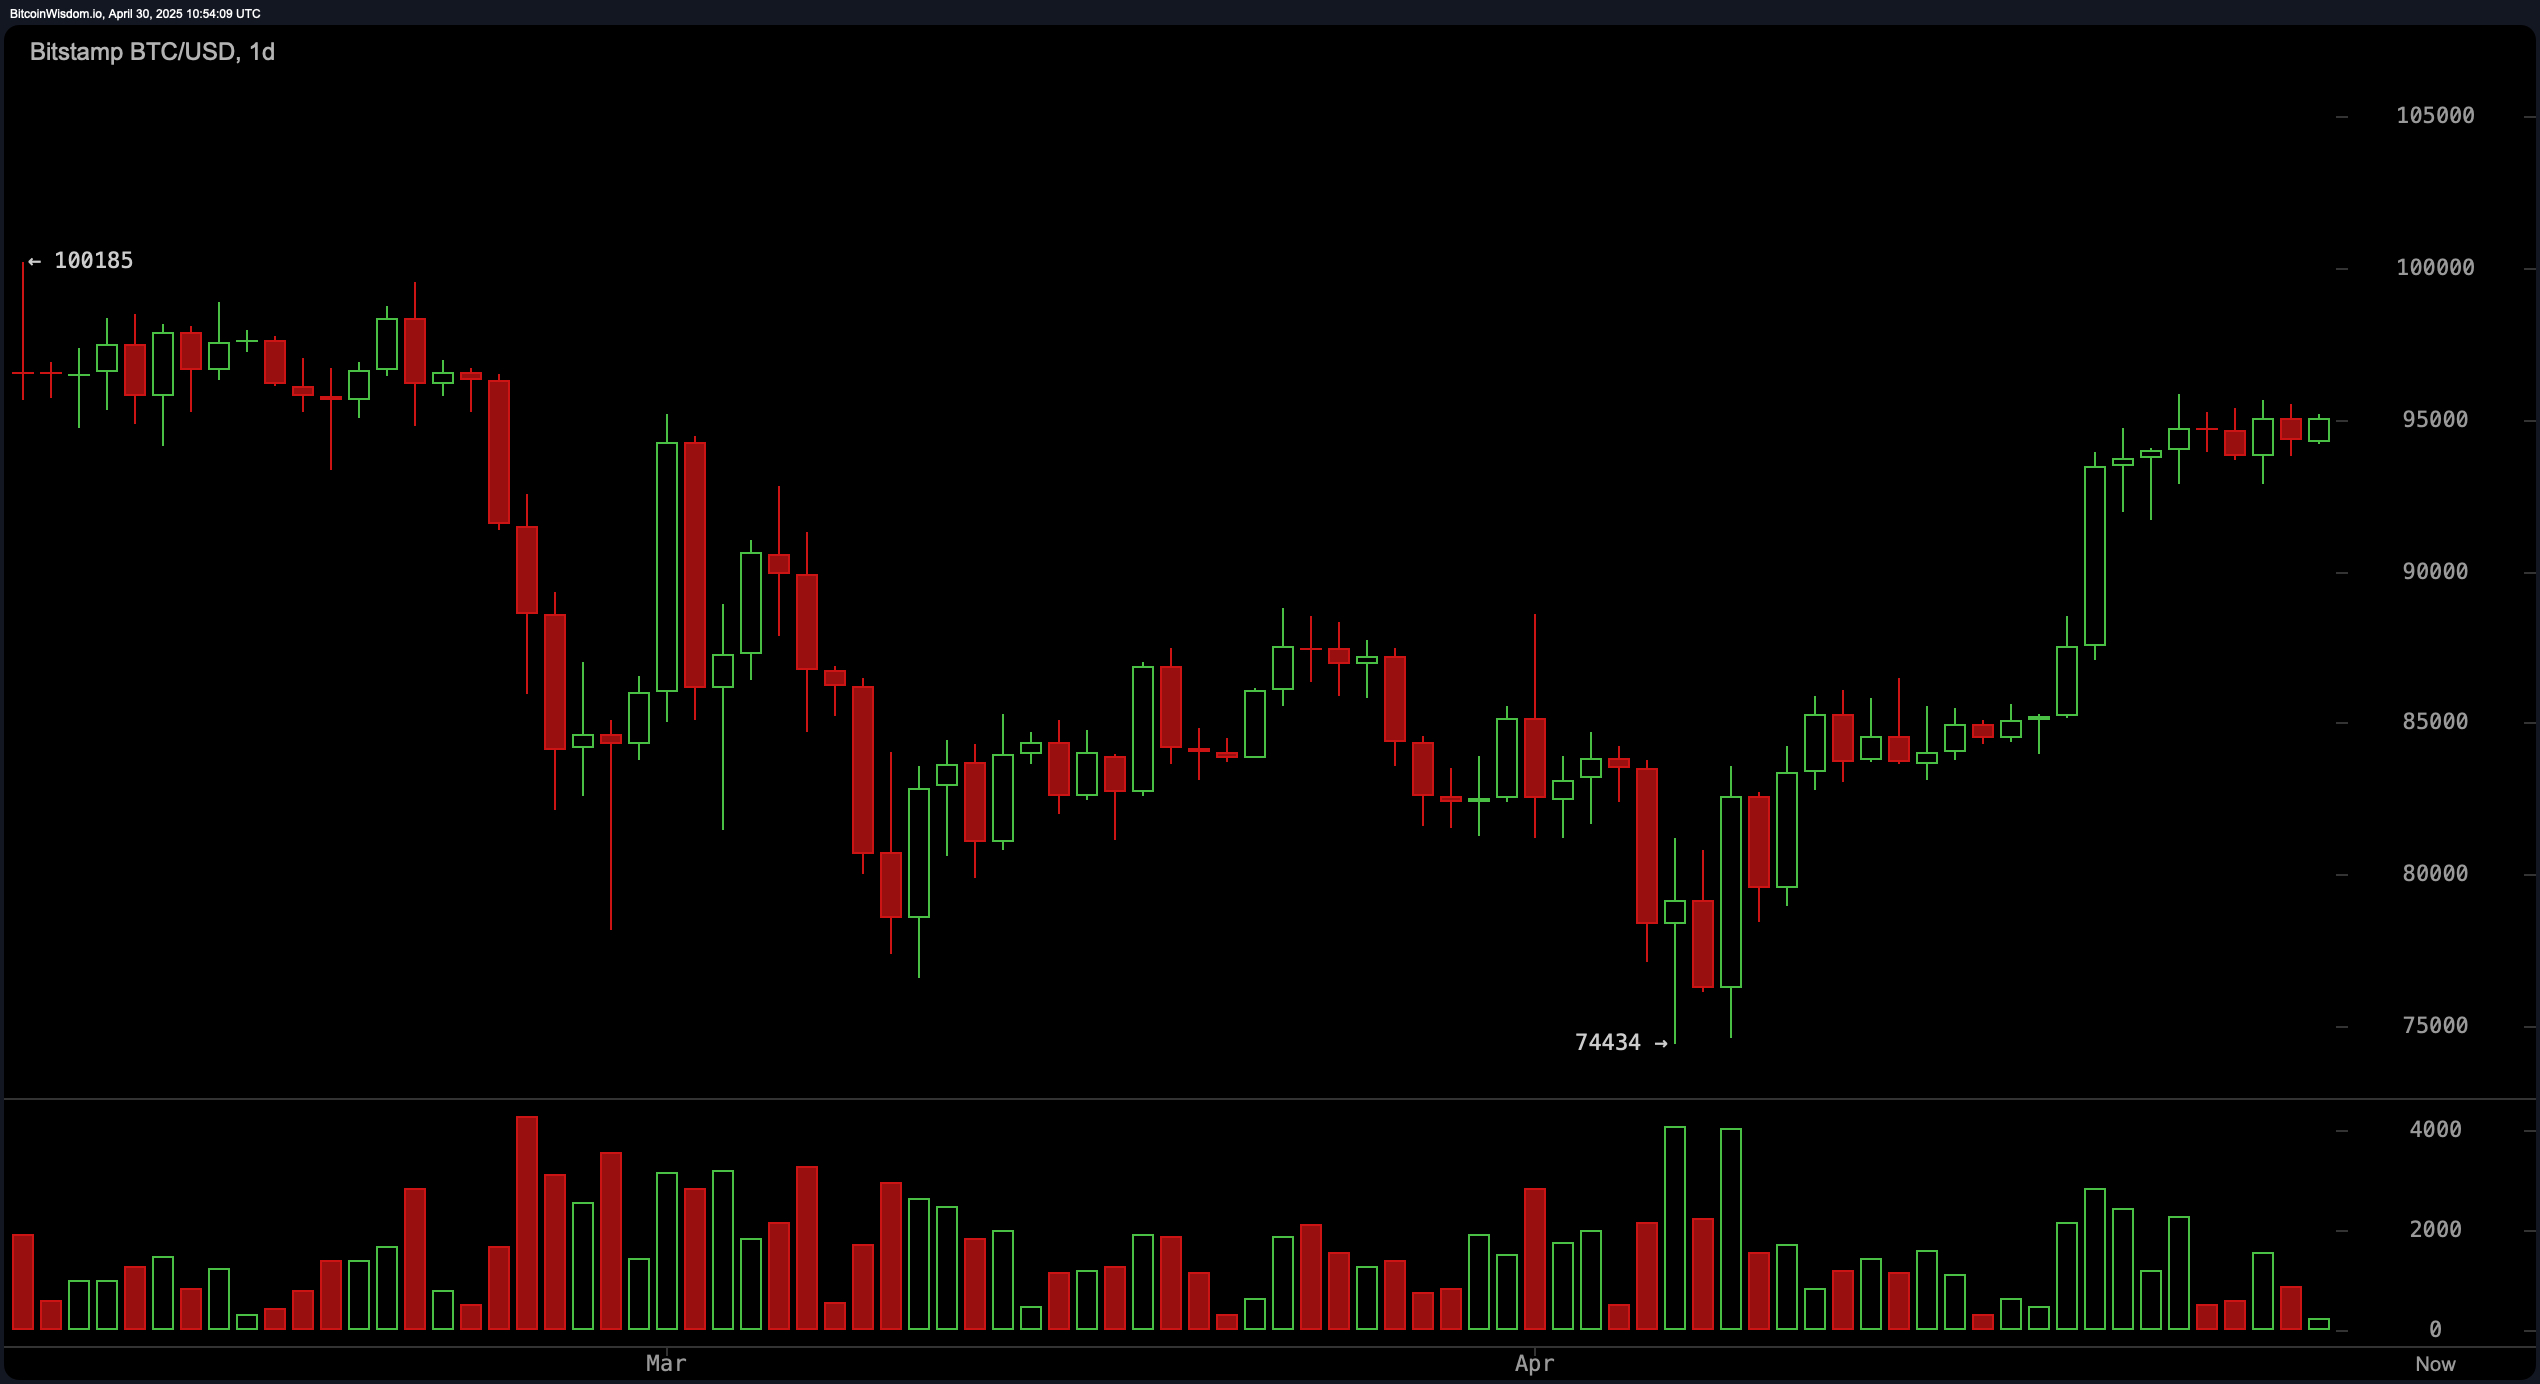
BTC/USD 1D chart on April 30, 2025.
BTC’s four-hour chart reveals a strong bullish trend from $83,300 to $95,800, followed by a tightening price range suggestive of an impending breakout. The structure remains favorable for bulls, maintaining higher highs and higher lows. Price compression in this timeframe, accompanied by watchful volume, may prelude a move toward the $98,000 to $100,000 range. Entry is favorable upon breakout above $95,800 with volume confirmation, while any drop below the recent higher low of $93,000 could signal a need to reassess short-term bullish positions.
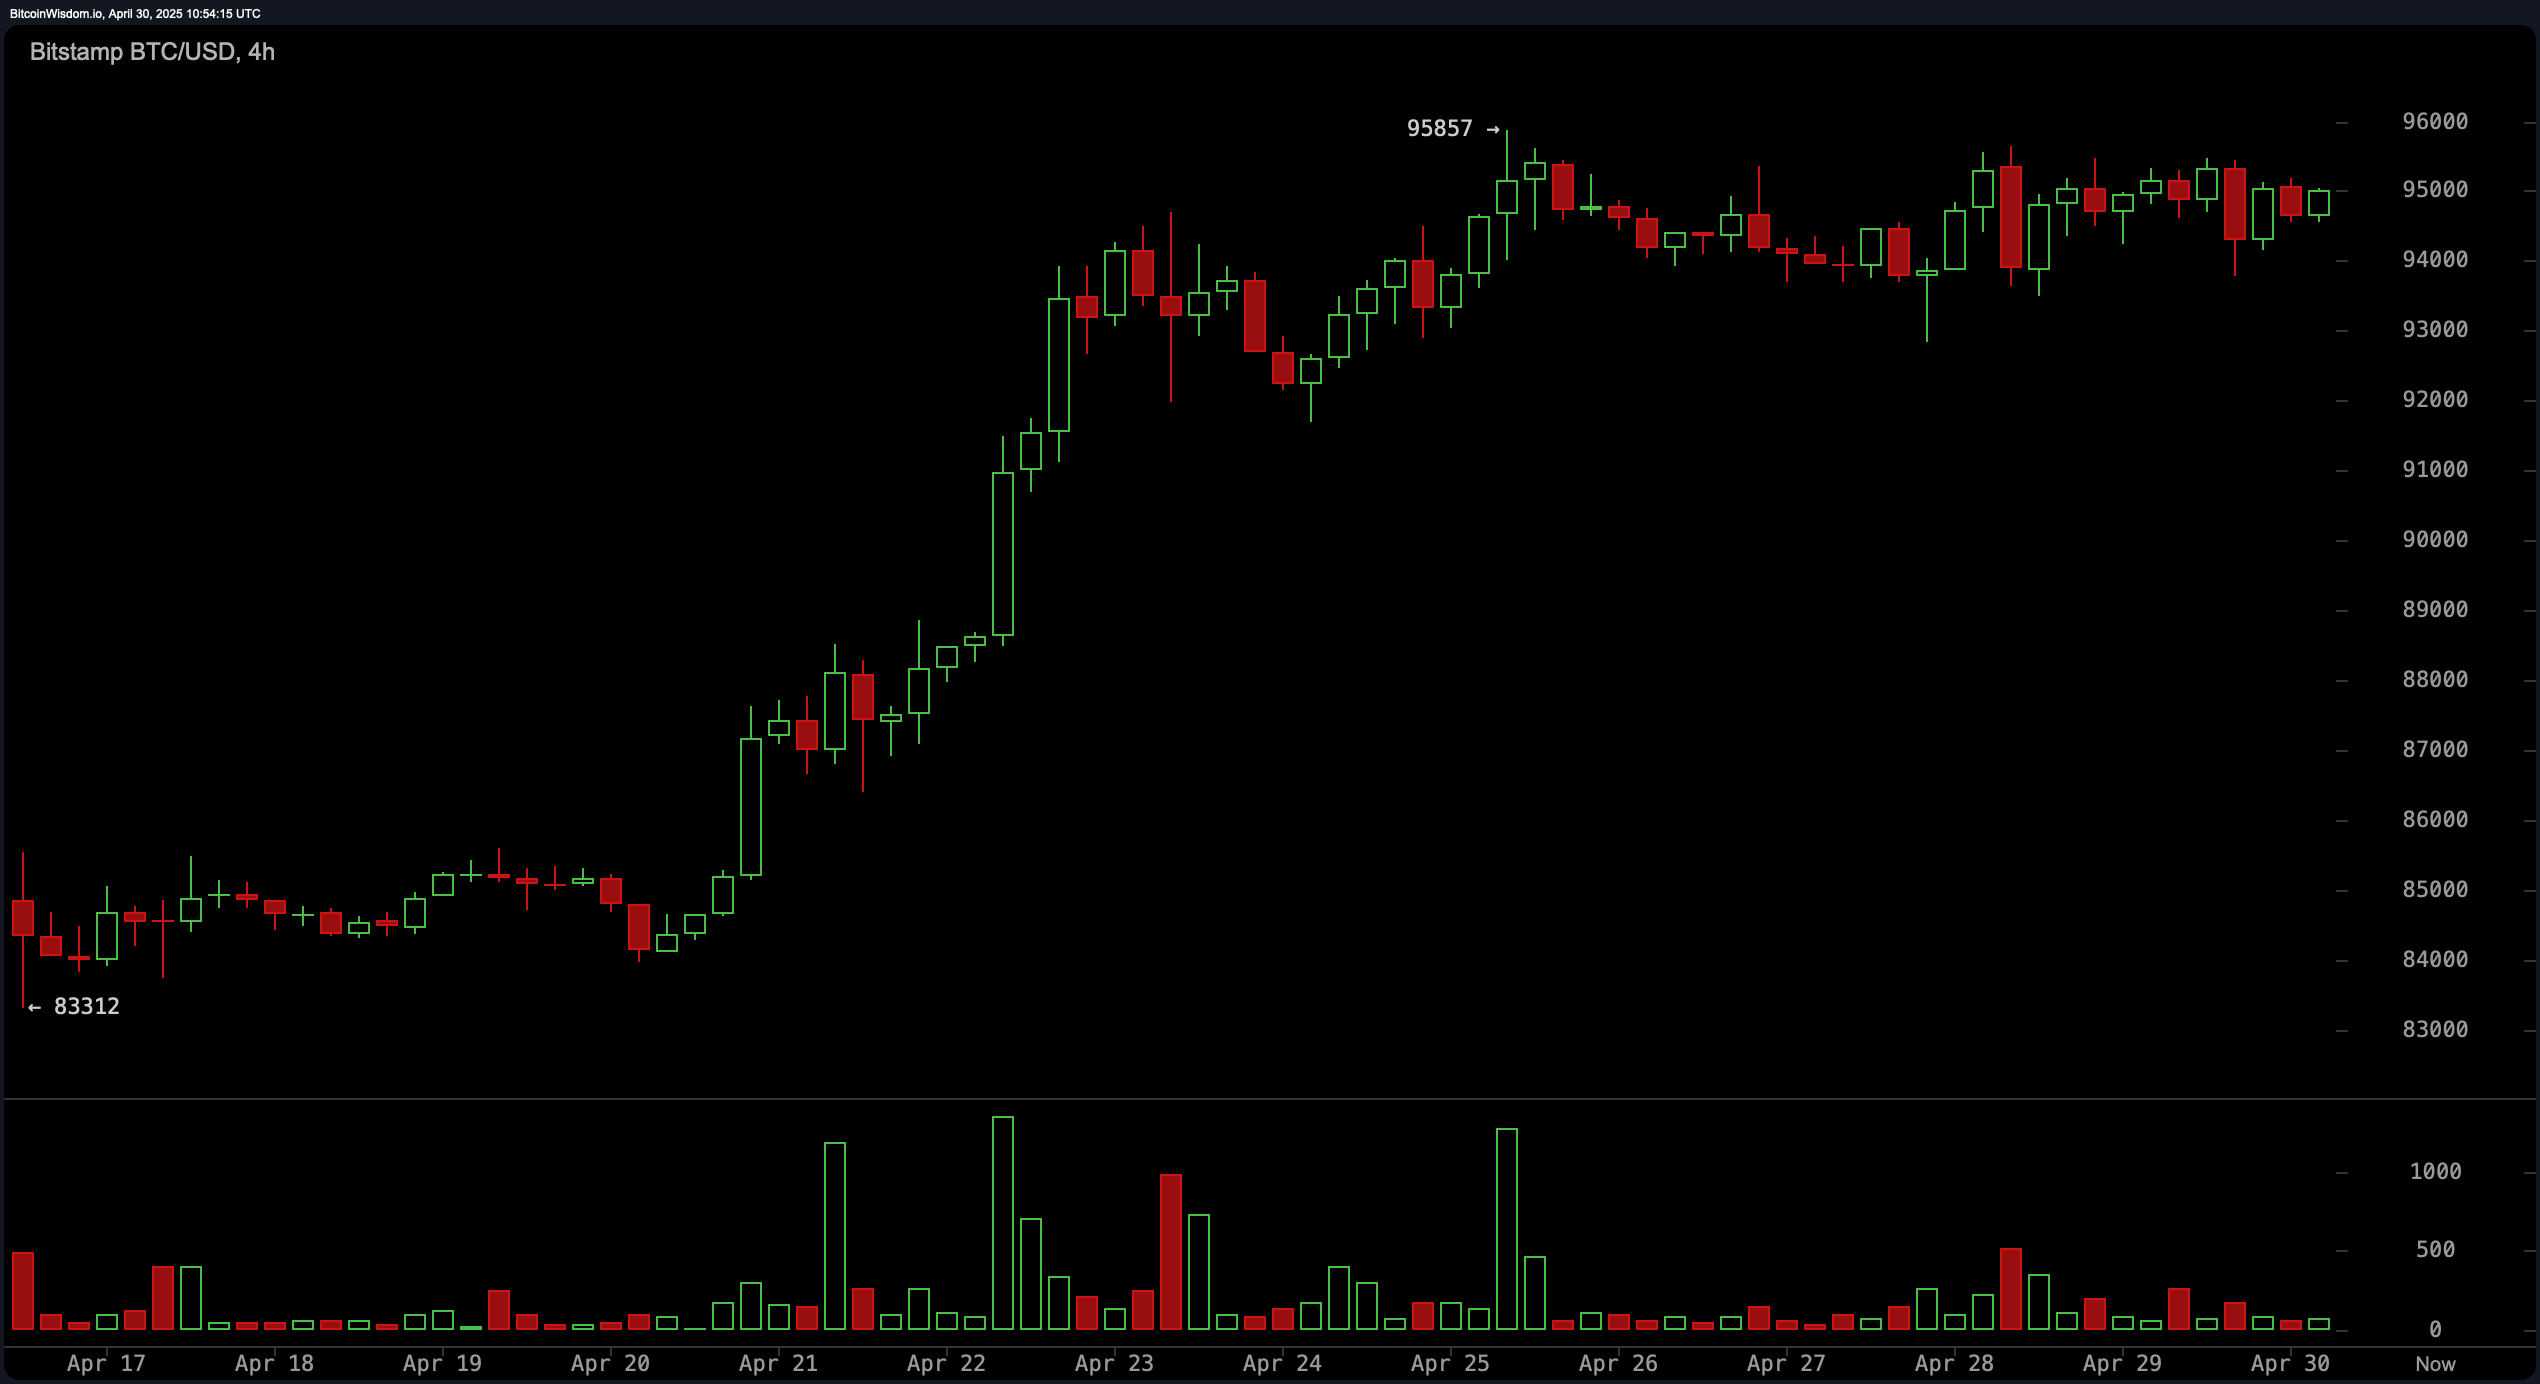
BTC/USD 4H chart on April 30, 2025.
On the one-hour chart, bitcoin exhibits choppy behavior, holding the $93,000 level as critical short-term support. Intraday movements have repeatedly tested $94,000, with several rejections near $95,600 suggesting overhead pressure. Volume has been decreasing, indicative of a cooling phase or market indecision. Scalpers may consider positioning near $93,000–$93,500 with tight stops below $92,800, targeting a short-term retest of the $95,000–$95,600 zone, while closely monitoring for bearish reversal signals such as lower highs or engulfing candlesticks.
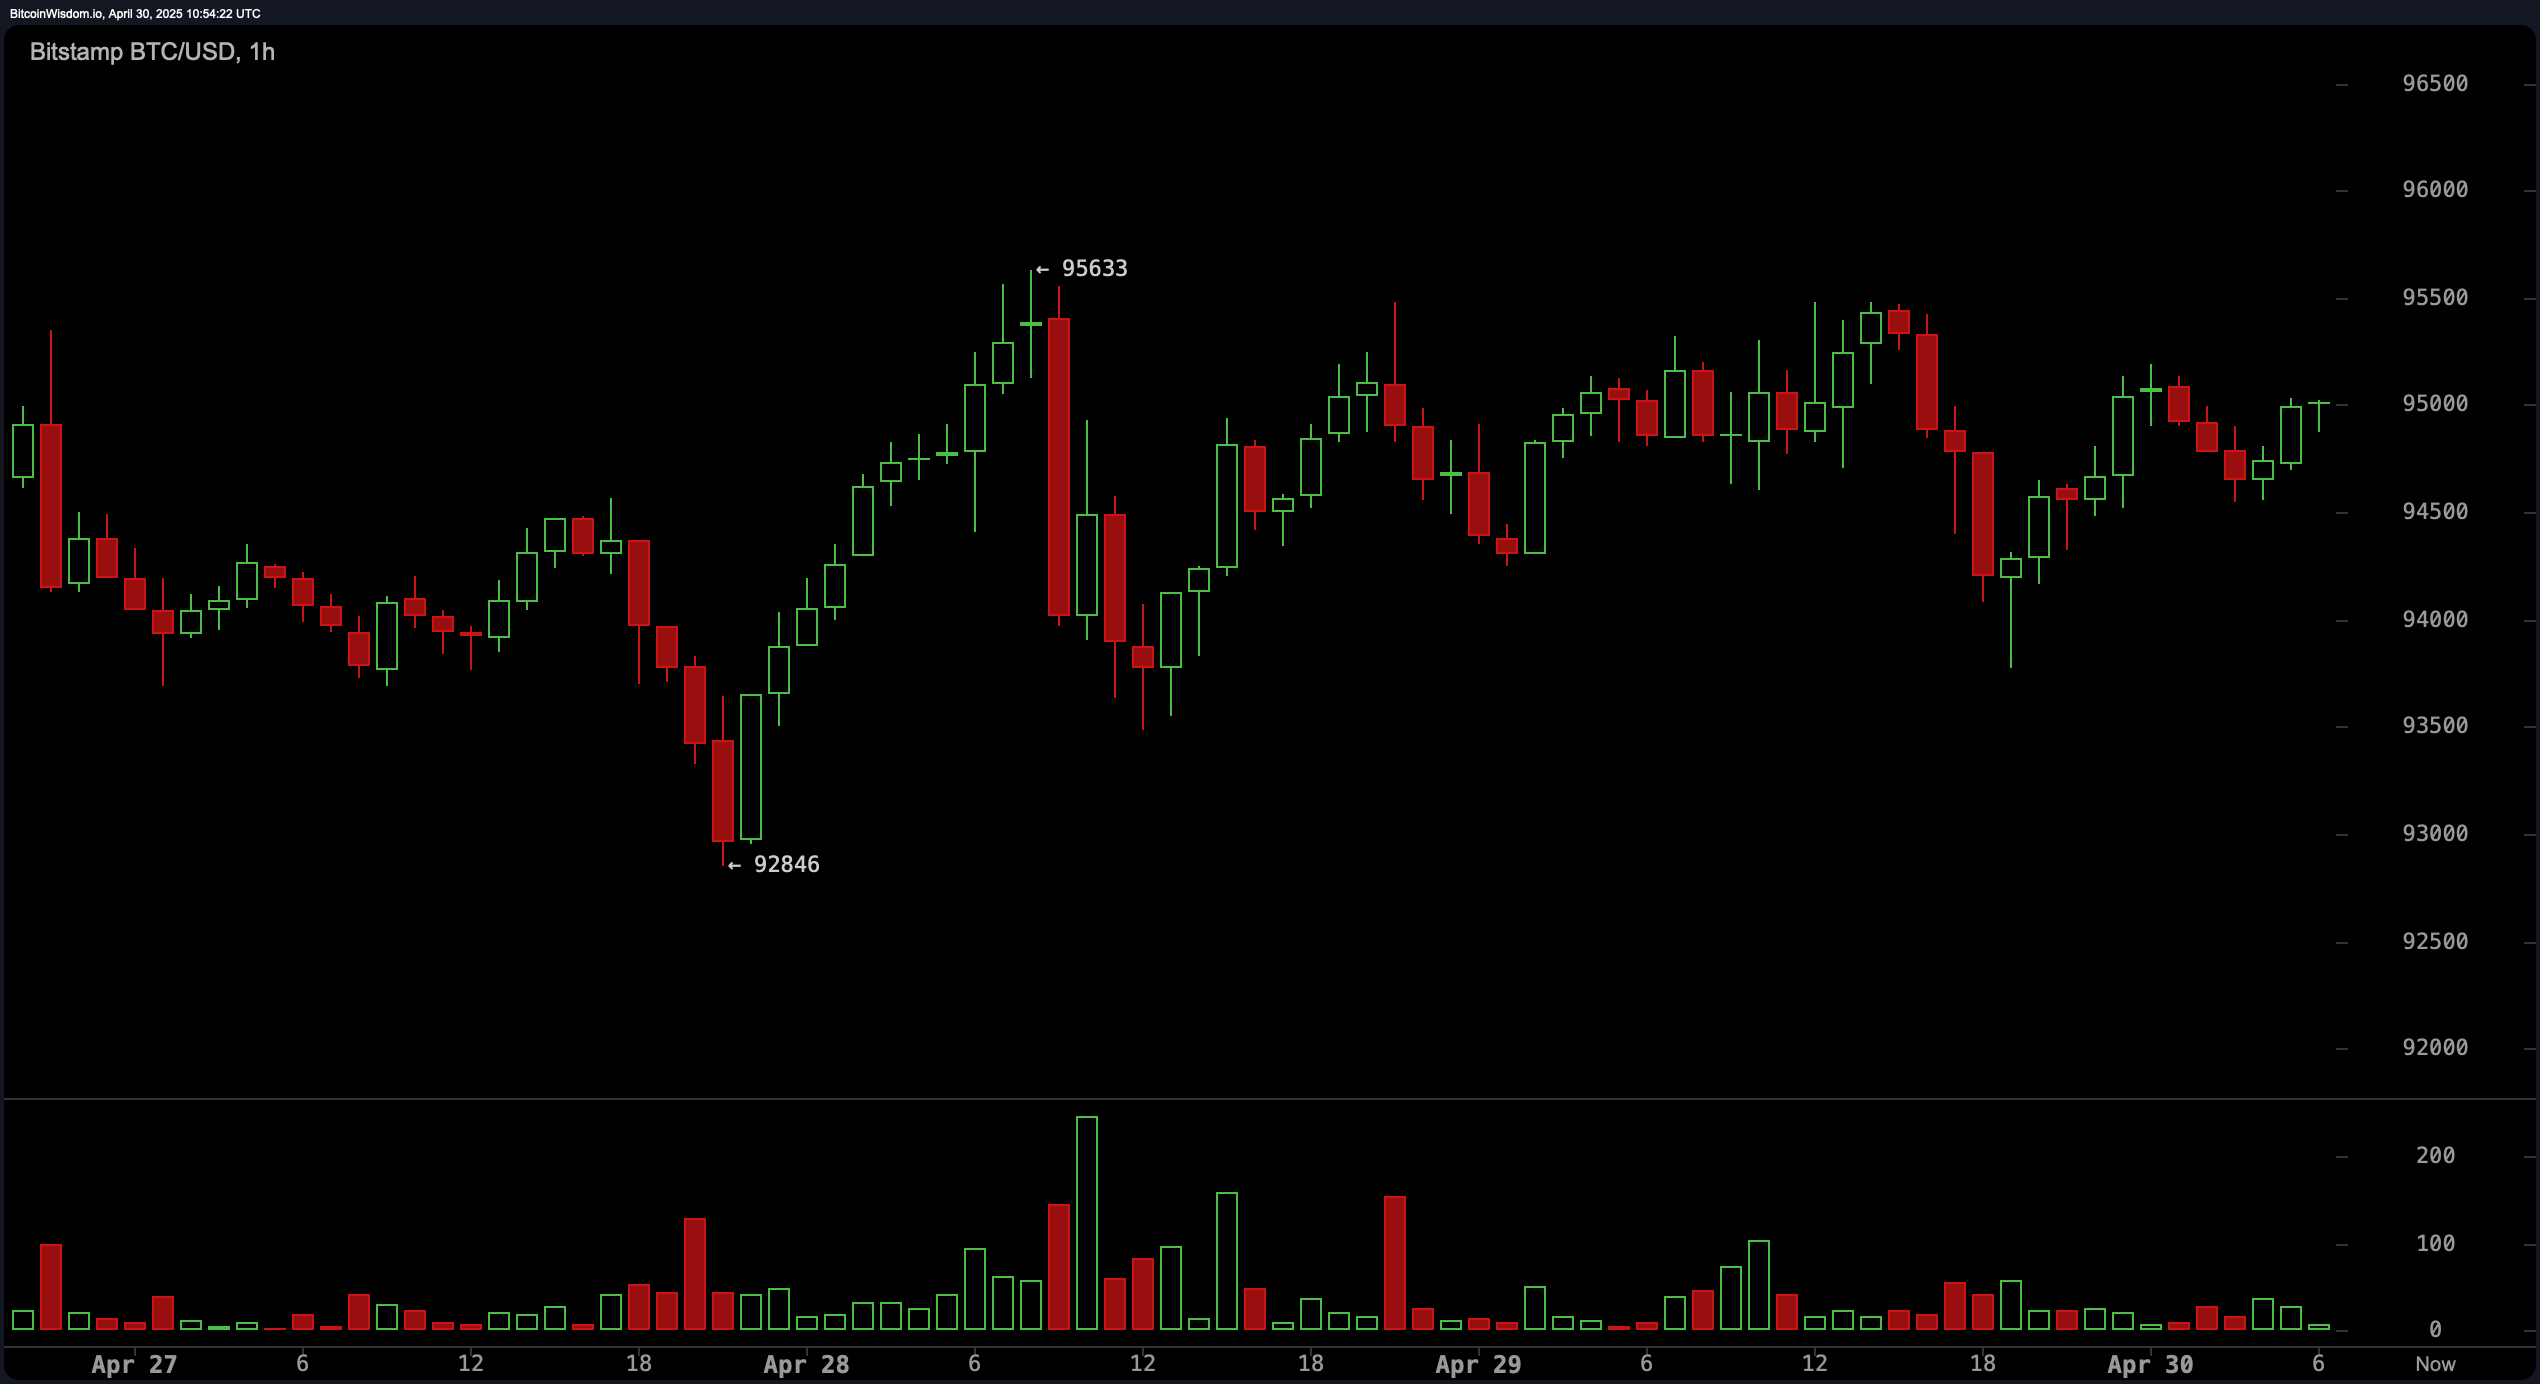
BTC/USD 1H chart on April 30, 2025.
From an indicator standpoint, oscillators remain predominantly neutral, with the relative strength index (RSI) at 67, Stochastic at 91, commodity channel index (CCI) at 86, and average directional index (ADX) at 30 — all pointing to balanced momentum. However, the momentum oscillator and moving average convergence divergence (MACD) level both signal optimism, suggesting that upside potential remains intact if supported by volume. The awesome oscillator also stays neutral, reinforcing a cautious optimism.
The moving averages paint a distinctly bullish picture. Every exponential moving average (EMA) and simple moving average (SMA) across the 10, 20, 30, 50, 100, and 200-period intervals signal upside actions. Notably, the exponential moving average (10) at $92,886 and the simple moving average (10) at $93,623 both lie below the current price, reinforcing short-term support. Similarly, the exponential moving average (200) and simple moving average (200) stand at $85,831 and $89,681, respectively, suggesting strong foundational support across timeframes and showcasing continued bullish market structure.
Bull Verdict:
Bitcoin’s technical posture remains decisively bullish across multiple timeframes, with strong support from both short-term and long-term moving averages and a clear trend of higher lows and recovering volume. A sustained breakout above $95,000 could open the path toward $98,000 and possibly $100,000, particularly if volume accelerates and oscillators begin to shift from neutral to supportive territory. Swing traders and long-term holders may find favorable risk-reward conditions with proper risk management near recent support levels.
Bear Verdict:
Despite the prevailing bullish structure, bitcoin’s struggle to decisively breach the $95,000 resistance coupled with decreasing intraday volume and neutral oscillator readings raises caution. Any breakdown below $93,000, particularly with a loss of the $92,800 support zone, could shift momentum back in favor of bears, targeting lower support at $90,000 and potentially $85,000. Without a confirmed breakout and volume confirmation, traders should be wary of bull traps near major psychological resistance.


Leave a Reply