
Bitcoin is consolidating just beneath its recent peak, following a sharp rally that pushed it to the upper bounds of this week’s trading range. The sustained strength in price action and volume highlights strong bullish sentiment, though key resistance at $95,500 remains a pivotal level to watch.
Bitcoin
Across the 1-hour chart, bitcoin shows short-term consolidation between $93,000 and $94,900 with a slight bullish tilt. The most recent hourly candle closed strong and bullish following a bounce off $91,700 support. A break and close above $94,500 could signal a fresh upward leg, while a rejection in the $95,000–$95,500 zone may trigger short-term selling pressure. For traders, aggressive entries above resistance with close monitoring of volume are critical at this juncture. Alternatively, signs of weakness here could prompt a pullback toward lower support levels.
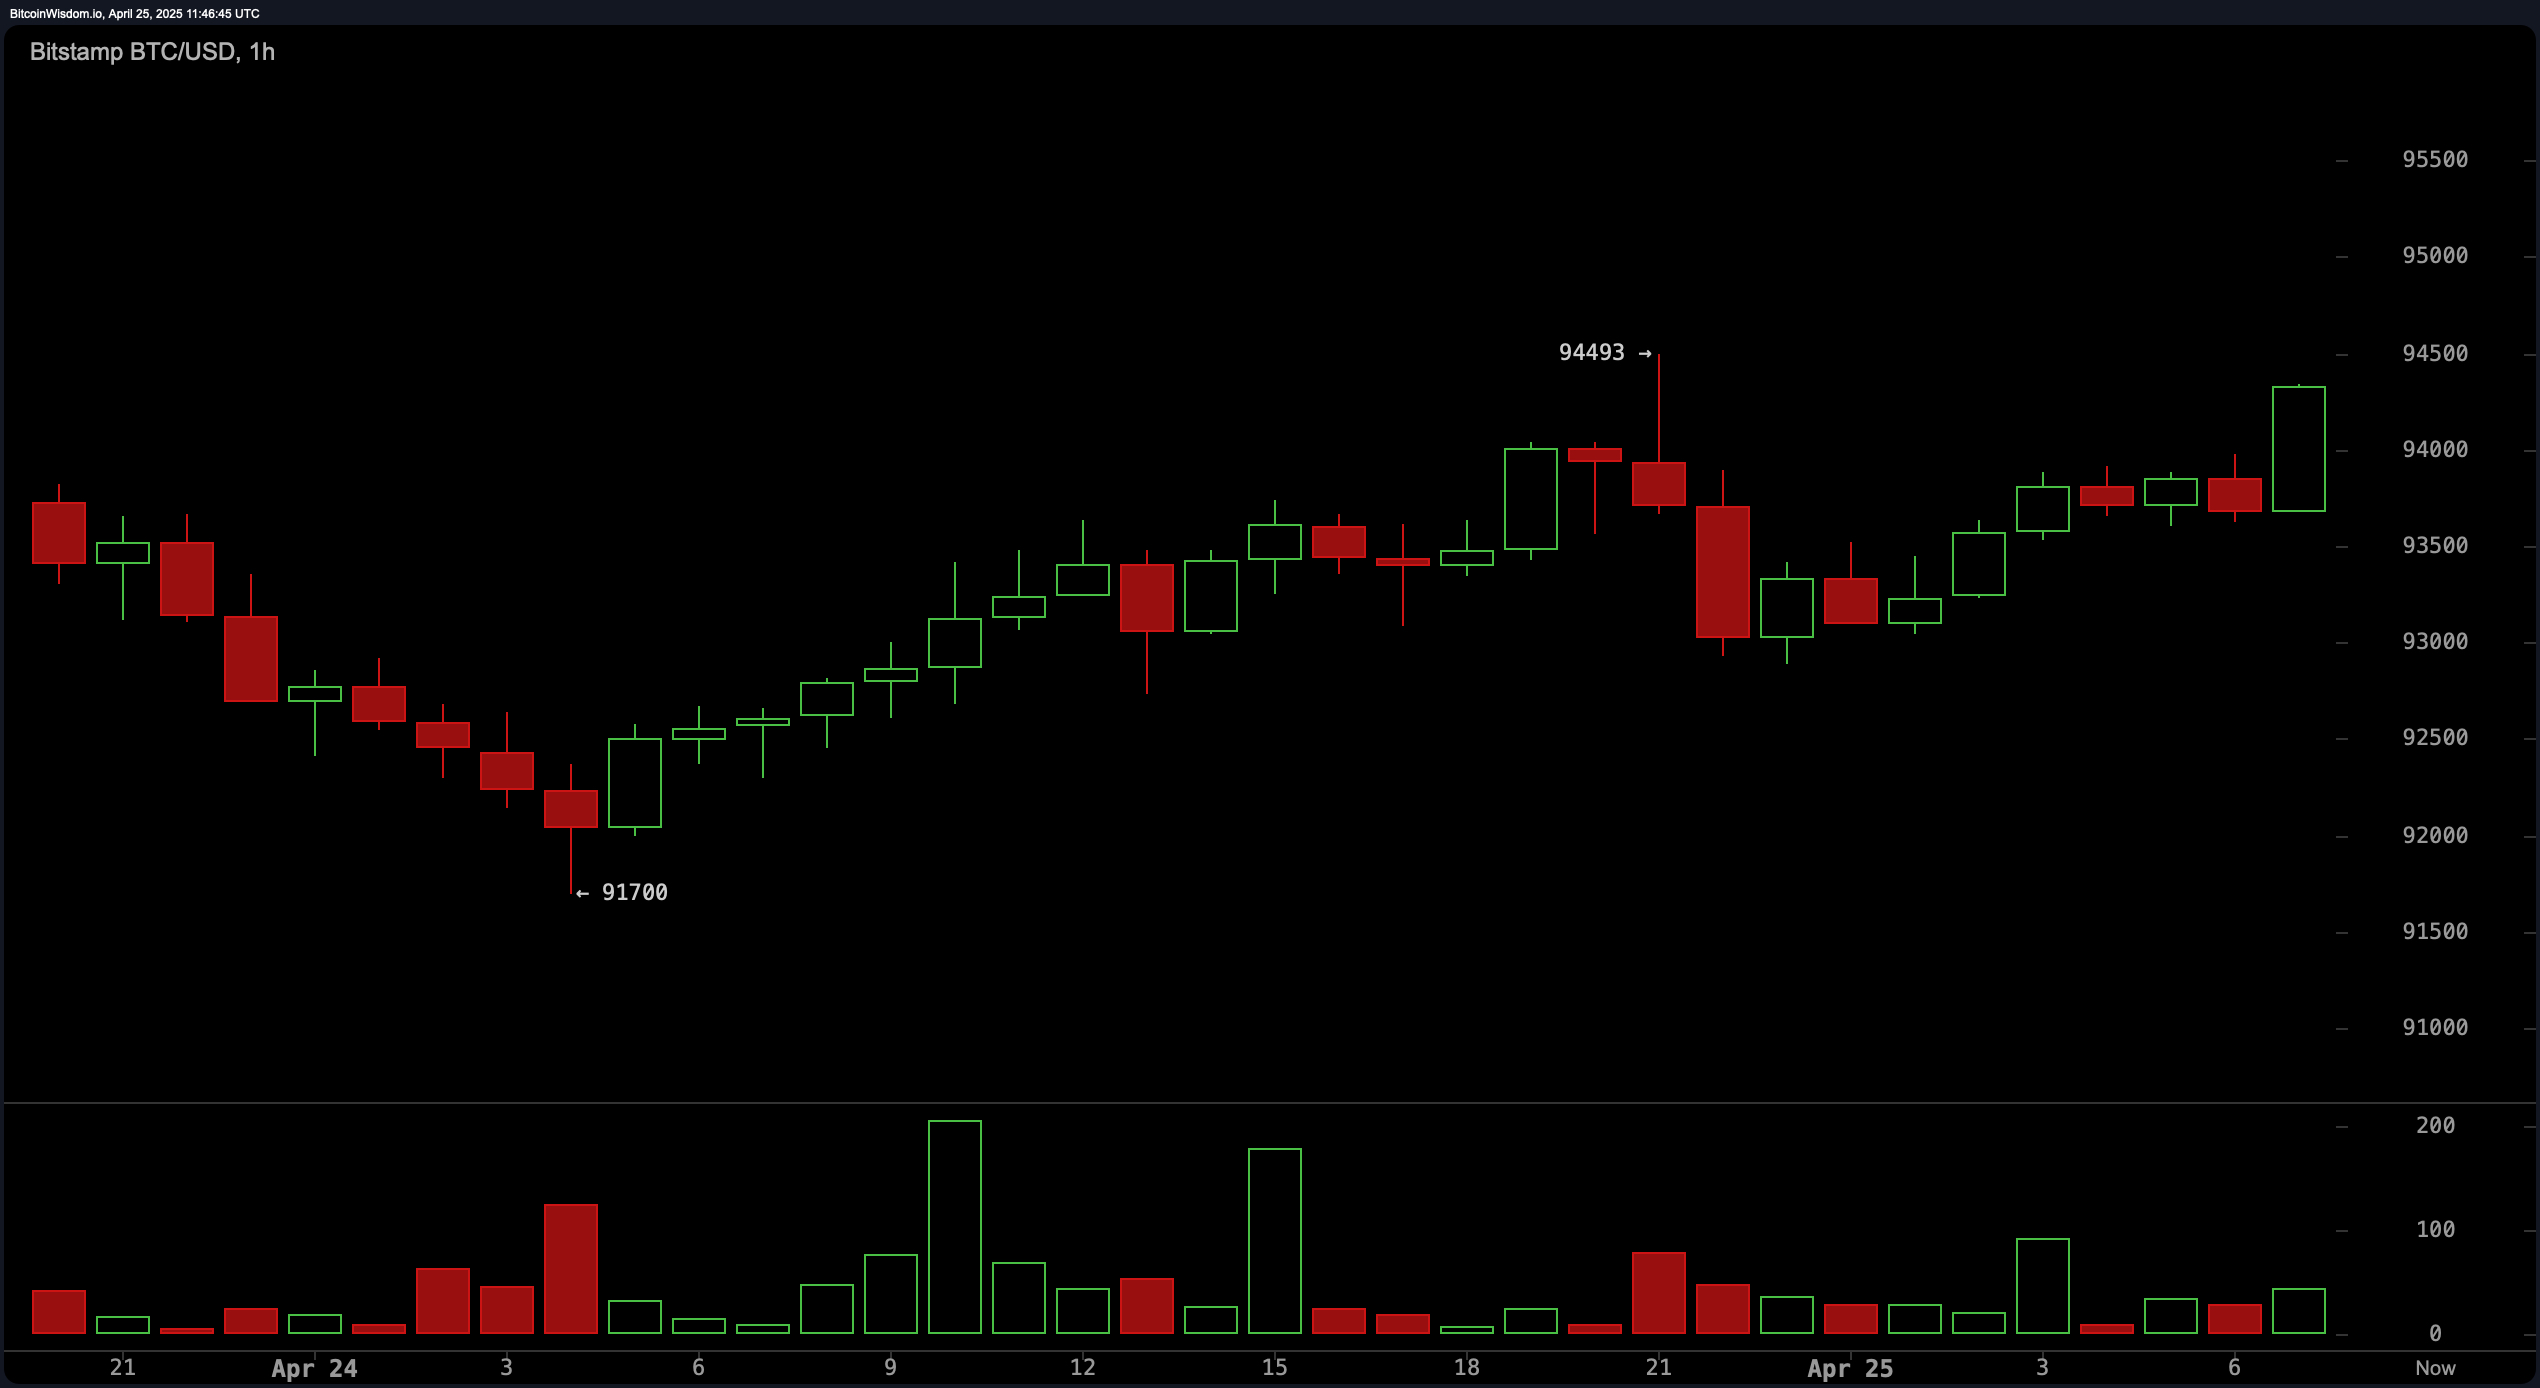
BTC/USD 1H chart via Bitstamp on April 25, 2025.
The 4-hour chart reflects a classic stair-step uptrend, where price action remains constructive amid shallow retracements. Following the breakout on April 22, volume spiked and has since cooled as bitcoin approached the $94,000 level. Support near $83,974 holds as the foundation of the current uptrend, with dips around $92,000 to $92,500 offering potential low-risk entry points. Without renewed volume and a break above $95,500, however, the rally may face fatigue. Strategic exits or partial profit-taking could be considered near these local highs if momentum appears to wane.
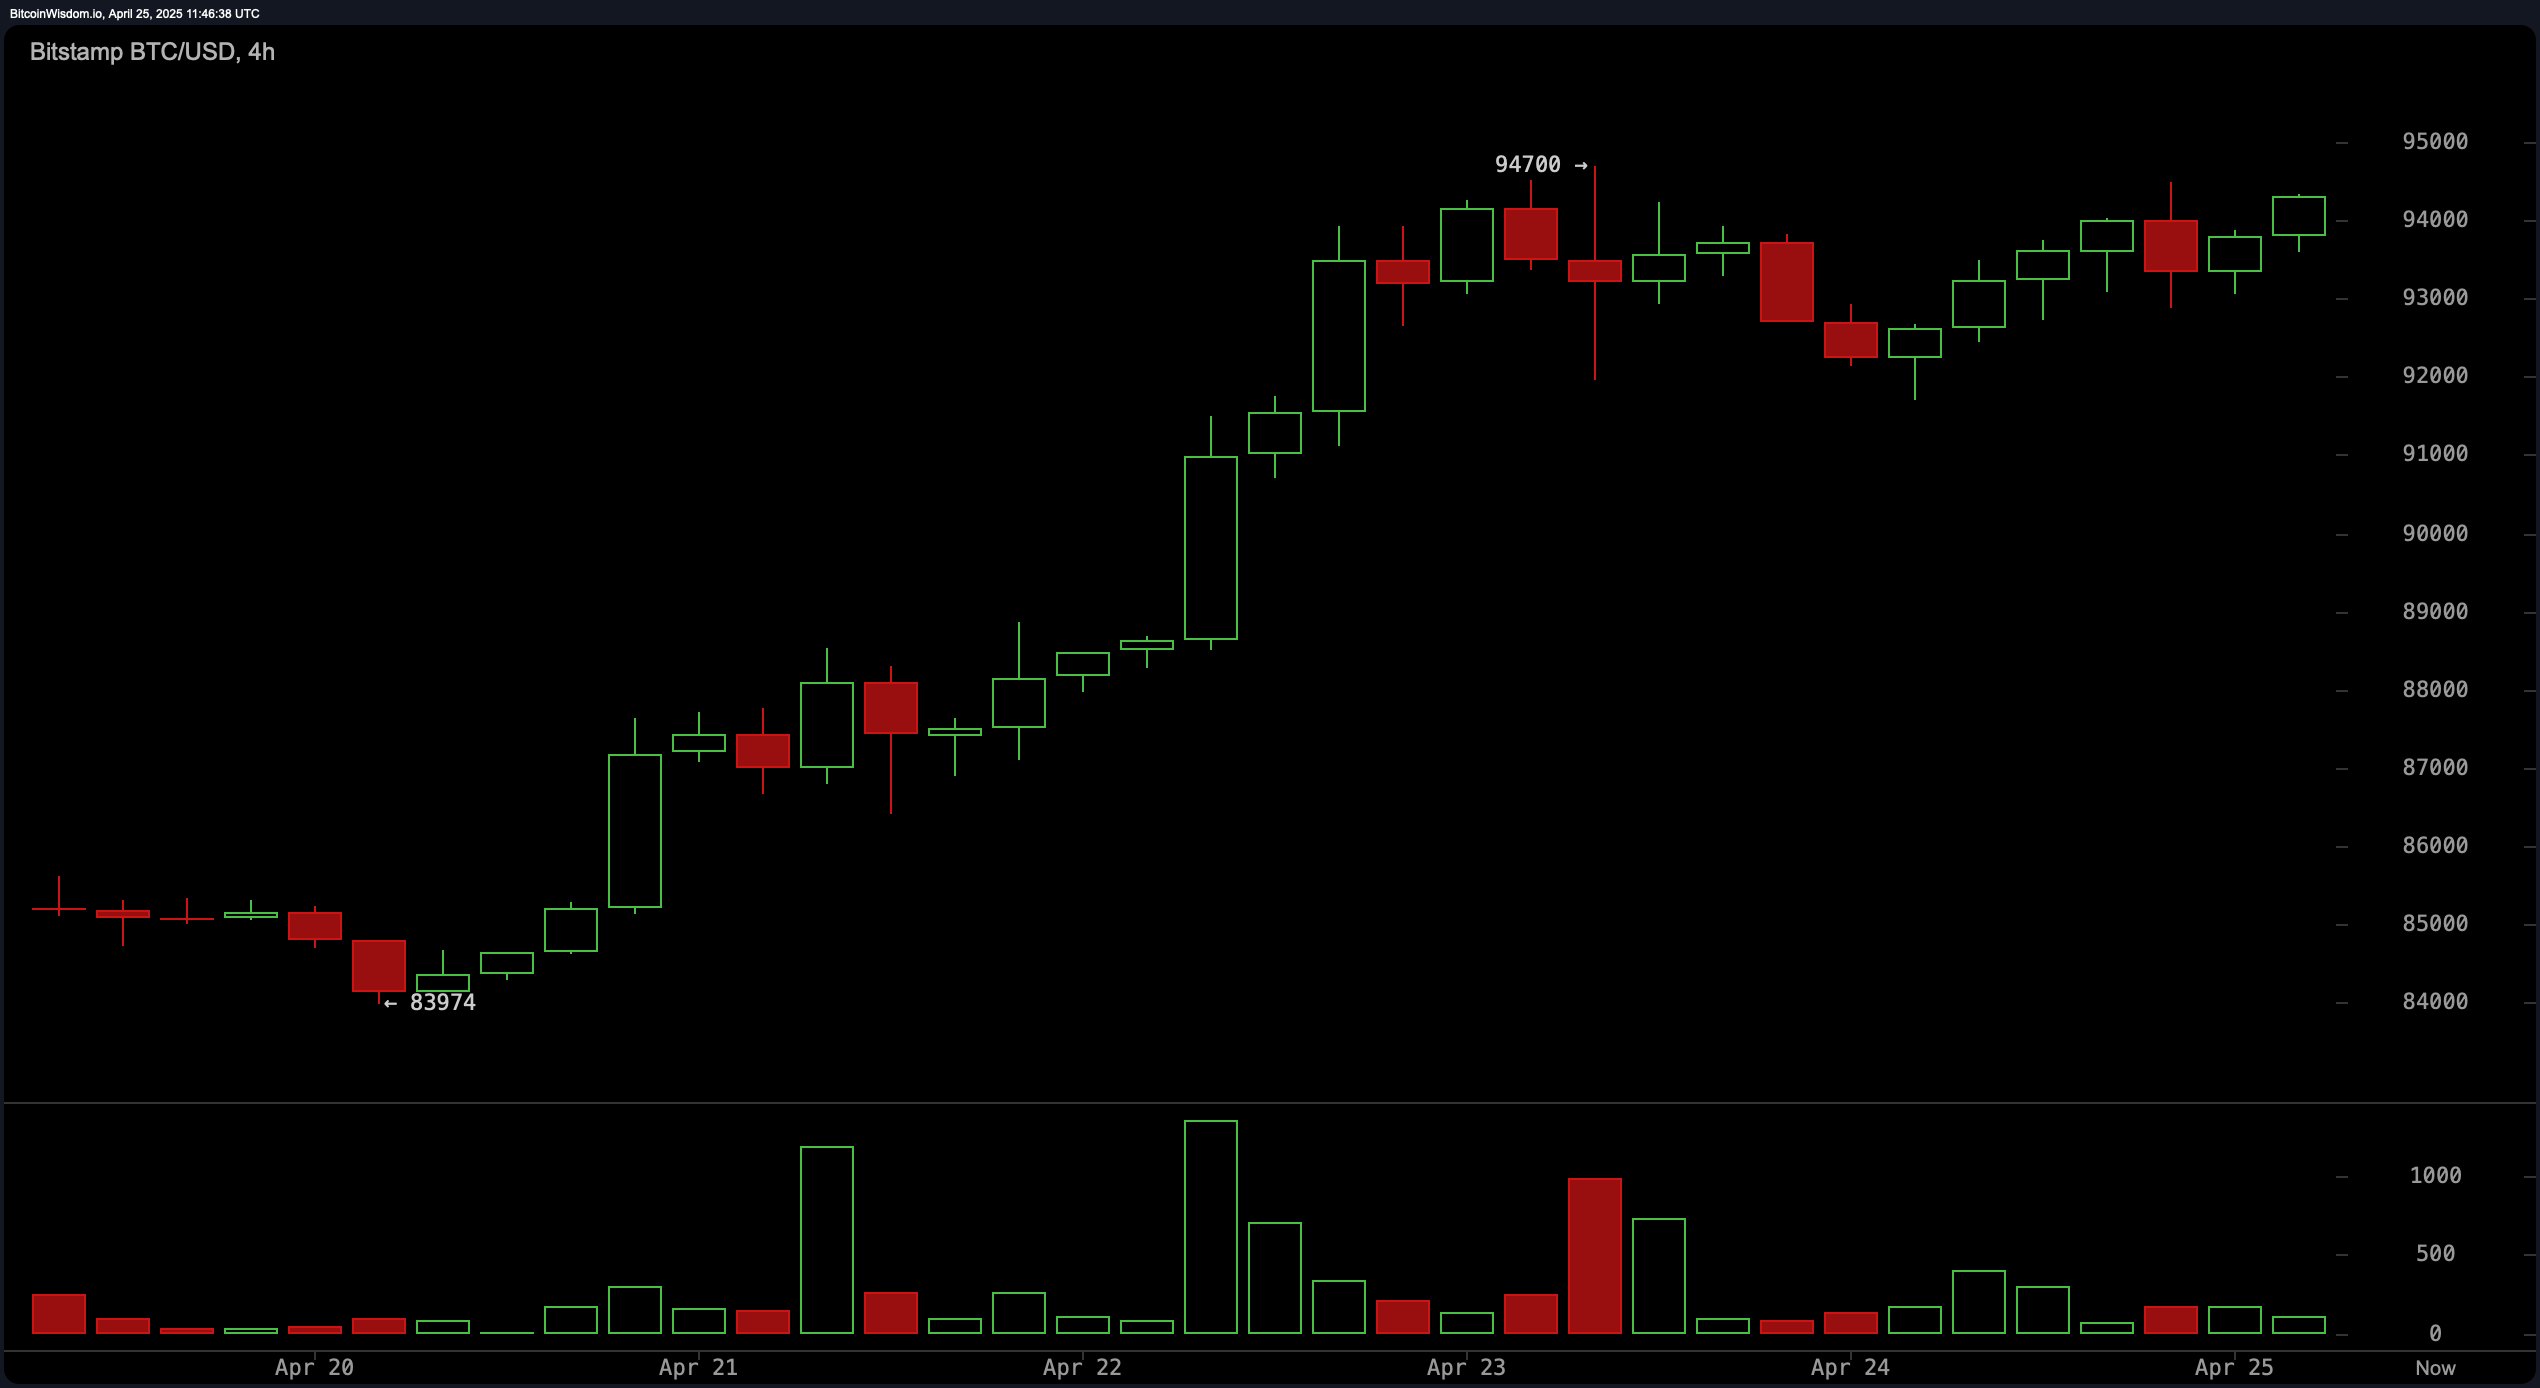
BTC/USD 4H chart via Bitstamp on April 25, 2025.
From a broader perspective, the daily chart reveals a pronounced bullish breakout from prolonged consolidation below the $86,000 mark. Bitcoin surged rapidly toward $95,000, supported by high volume, confirming a genuine upward thrust. While this breakout signifies a shift in trend dynamics, daily candles have begun to tighten, suggesting a slowing pace. Retests in the $90,000–$91,000 region may offer a second-chance entry if prior resistance turns into support. Still, caution is warranted if momentum fails to extend beyond the $95,500 resistance level.
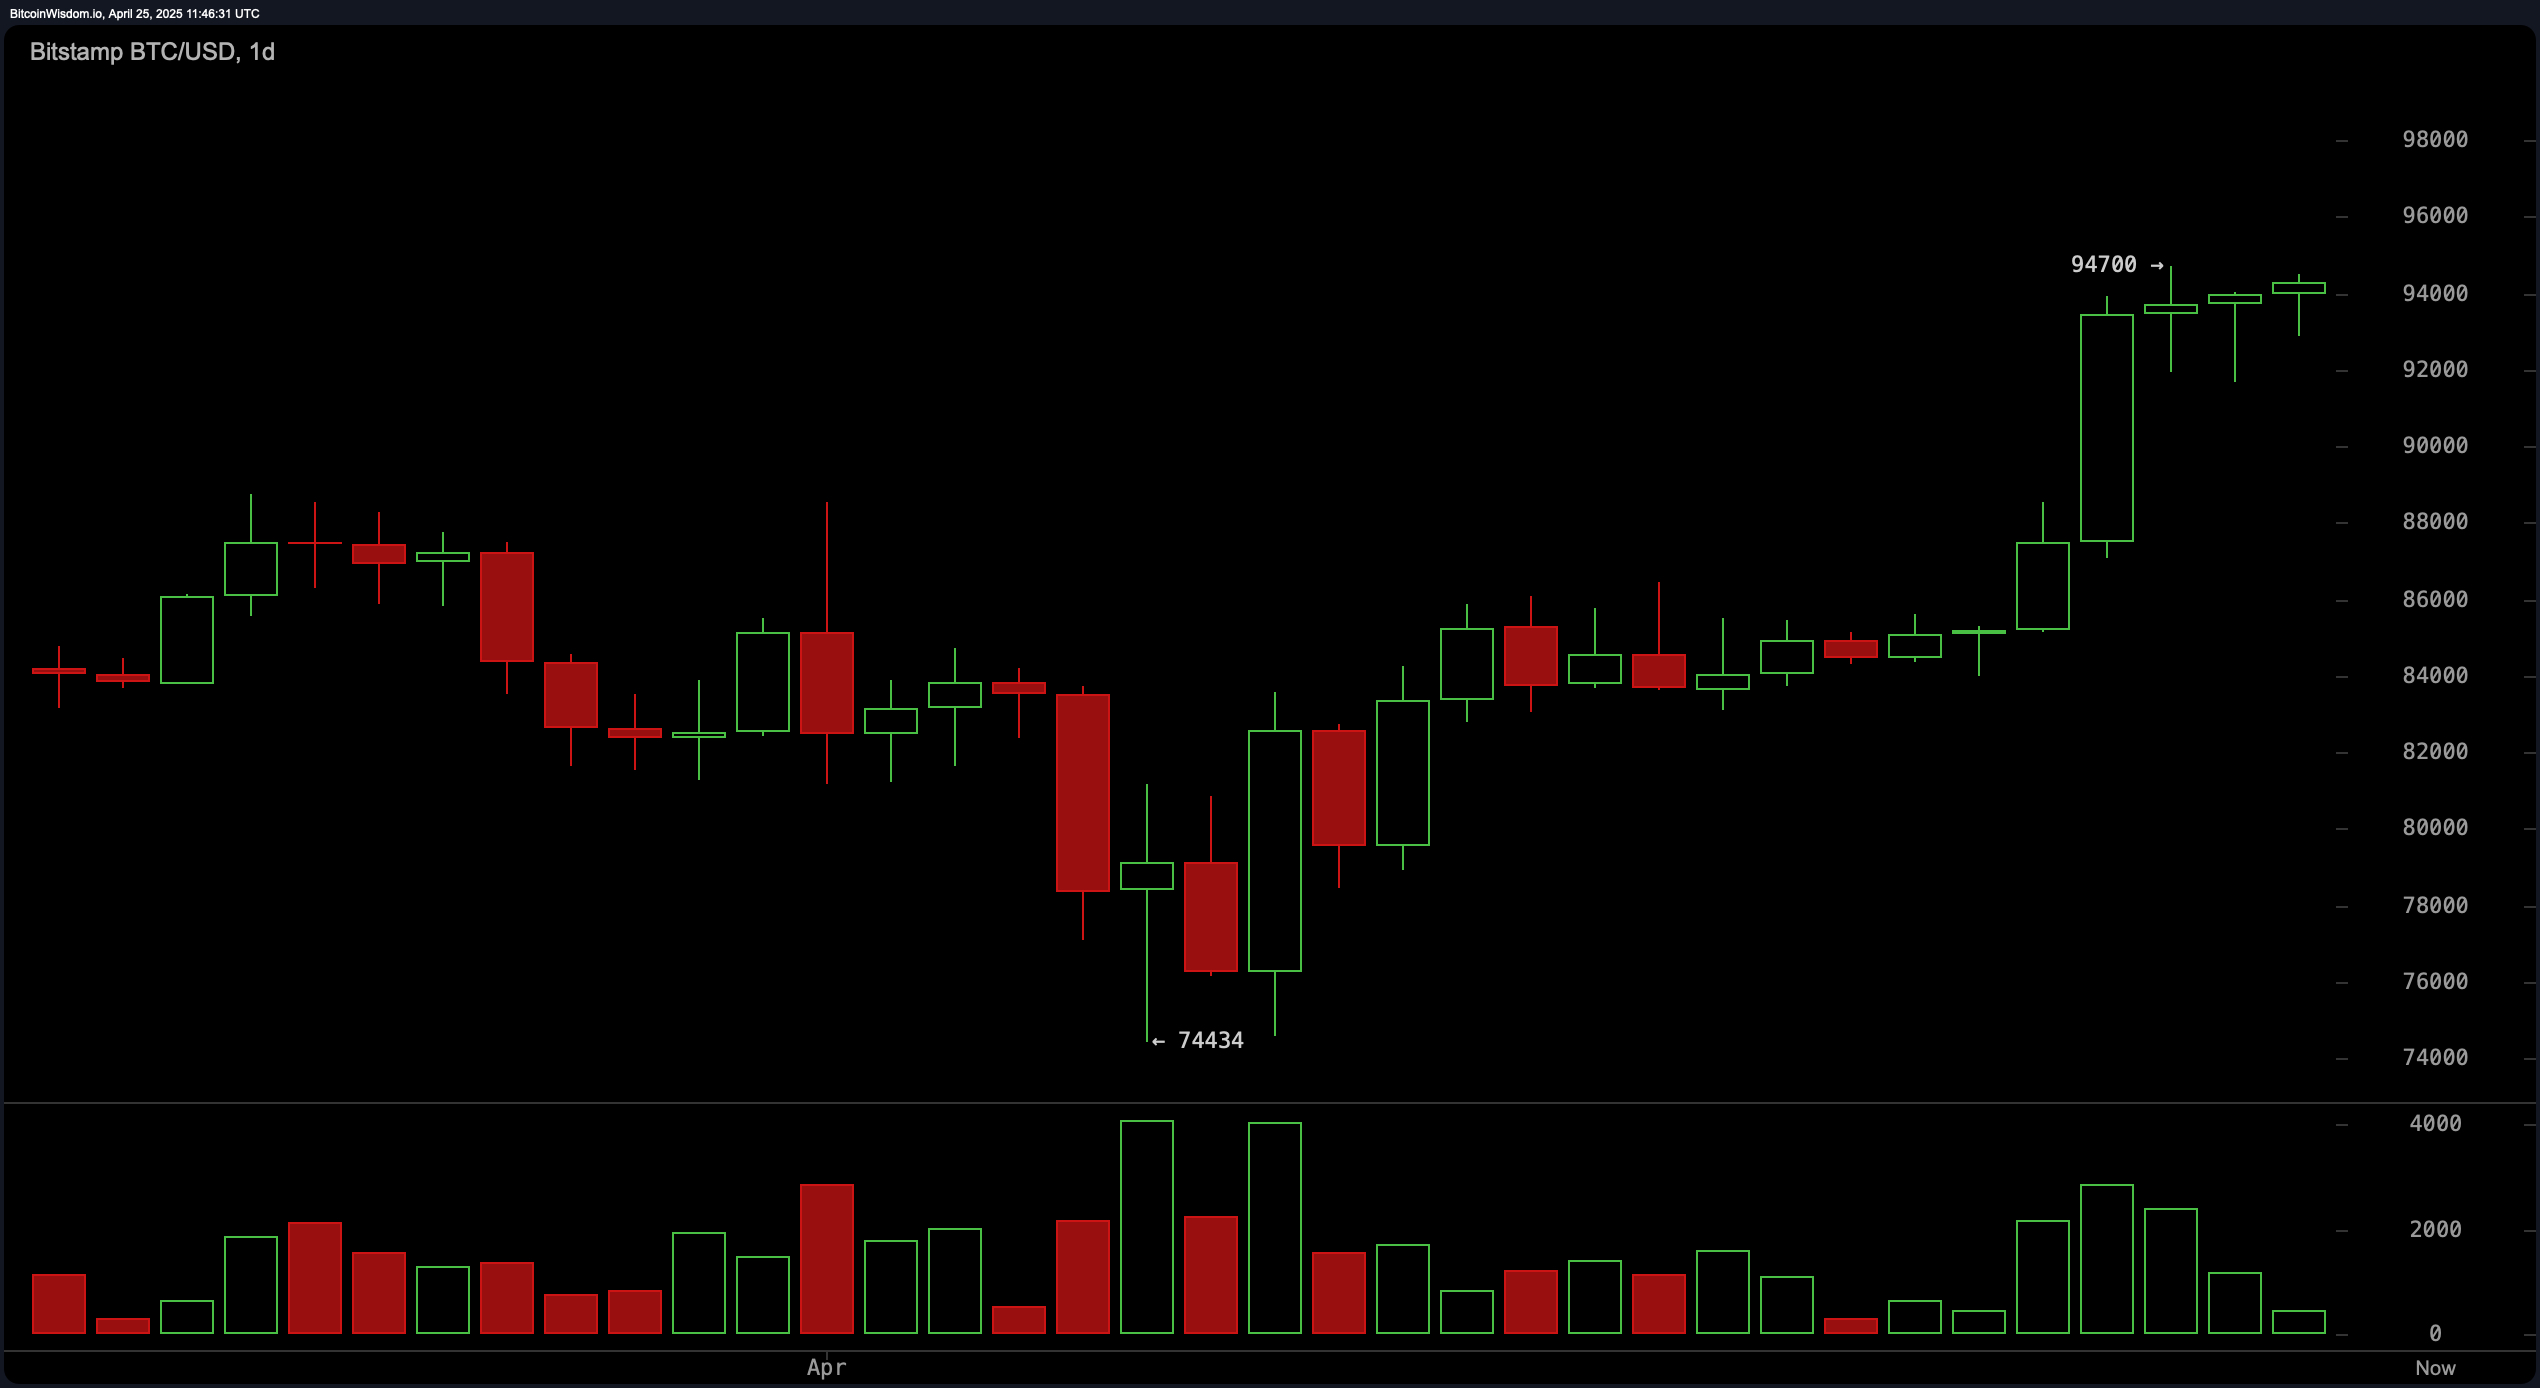
BTC/USD 1D chart via Bitstamp on April 25, 2025.
Oscillator readings are mixed, reflecting a market that is bullish yet cautious. The momentum and moving average convergence divergence (MACD) both indicate a buy, reinforcing the strength of recent upward moves. In contrast, the commodity channel index (CCI) suggests an overbought condition with a sell signal, while the relative strength index (RSI) and Stochastic remain neutral, indicating that the market could go either way in the short term. These readings reinforce the importance of closely monitoring resistance levels and intraday structure to effectively navigate potential reversals or breakouts.
Supporting the bullish outlook, all moving averages, both exponential and simple across 10 to 200 periods, signal a buy. Notably, the exponential moving average (10) and simple moving average (10) trail current price levels by several thousand dollars, affirming a healthy momentum bias. The alignment of higher time-frame moving averages like the exponential moving average (200) at $85,380 and simple moving average (200) at $88,858 further solidifies the long-term trend as bullish. Until bitcoin convincingly breaches and sustains above $95,500, however, the potential for range-bound behavior persists, warranting strategic patience.
Bull Verdict:
Bitcoin continues to trade in a structurally bullish environment, supported by a strong foundation of rising moving averages and favorable oscillator signals such as the momentum and moving average convergence divergence (MACD) (12, 26). The consolidation just below $94,500 presents a launchpad scenario, where a confirmed breakout above $95,500 could trigger a swift move toward uncharted highs. As long as support zones around $91,700 and $90,000 hold, the bullish case remains intact.
Bear Verdict:
Despite bitcoin’s impressive run, overbought signals from the commodity channel index (CCI) and a lack of conviction at resistance hint at potential exhaustion. The tight range near the top of the current structure may precede a corrective phase, especially if the price fails to hold above the $92,000–$91,700 support zone. A sustained rejection at $95,500 and weakening volume could pave the way for a short-term retracement toward the mid-$80,000s.


Leave a Reply