
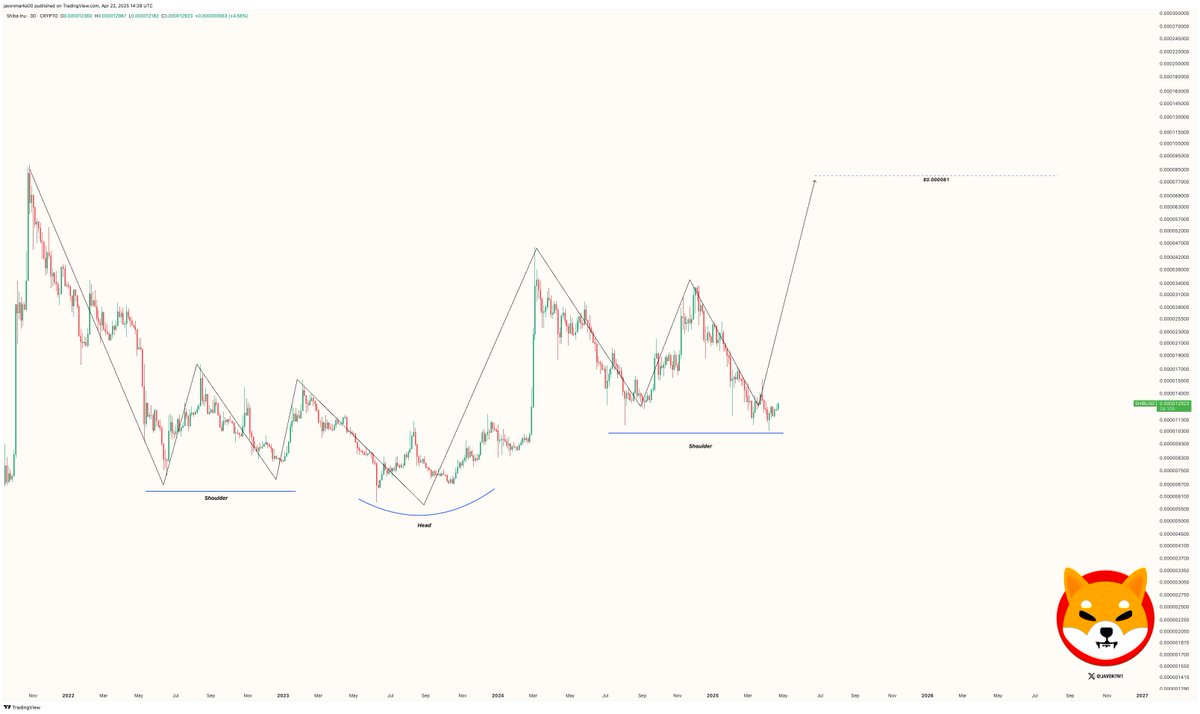
Shiba Inu (SHIB) price has formed what looks like a classic inverse head and shoulders pattern on its long-term chart. The common setup of this is when there has been a downtrend and it may be that the prices are looking to reverse.
In SHIB’s case, the structure is visible with clear support areas around $0.0000080 forming the “shoulders” and a deeper drop to around $0.0000060 marking the “head.”
The prices would have to break above the neckline, which measures between $0.000015 and $0.000017. If that occurs, it shows that there could potentially be a price target of $0.000081 in the chart setup.
Such a jump of more than 500% from the current level near $0.00001313 would be massive. Traders are watching this pattern closely as SHIB holds just above the right shoulder, a point that often signals a breakout is near.
Heavy Sell Pressure Between $0.000013 and $0.000015
While the chart pattern may be setting up for a move higher, data shows a key challenge right above SHIB’s current price. According to IntoTheBlock, more than 22.7 trillion SHIB tokens are held by over 49,000 wallets in the $0.00001300 to $0.00001500 range. They purchased within higher levels and are now not in profit.
If this price climbs into this range some of these holders may be tempted to sell. That may cause it to slow down or even halt the upward move. It’s always tough for the market to digest a concentrated token supply of this kind, without one pullback or pause.
Source: IntoTheBlock
Breaking through this group of sellers on the other hand represents a clear challenge for the chart that may be signaling strength. Until SHIB clears that zone, the rally may remain stuck below the neckline level.
Shiba Inu Price Eyes Explosive 500% Rally—But 22 Trillion Tokens Stand in the Way
At the moment, SHIB was priced at $0.00001313, showing a 5.70% gain over the last 24 hours. Over the past week, the token is up by more than 11%. These moves come with strong trading activity, with daily volume reported at $208 million. SHIB’s total market value now stands at about $7.76 billion.
With a supply of 590 trillion tokens, any price movement draws a lot of attention from retail and larger players. The volume surge shows renewed interest, but where the price goes next will depend on whether buyers can keep up the pressure as SHIB approaches the $0.000015 mark.
Crypto trader Lars Kooistra has also taken a long position on SHIB. He based this on a pattern he tracks, known as the TCT model 1, which shows that SHIB could be in an early stage of price recovery. Also, this has been a model for big cap tokens in times of accumulation before a major rally.
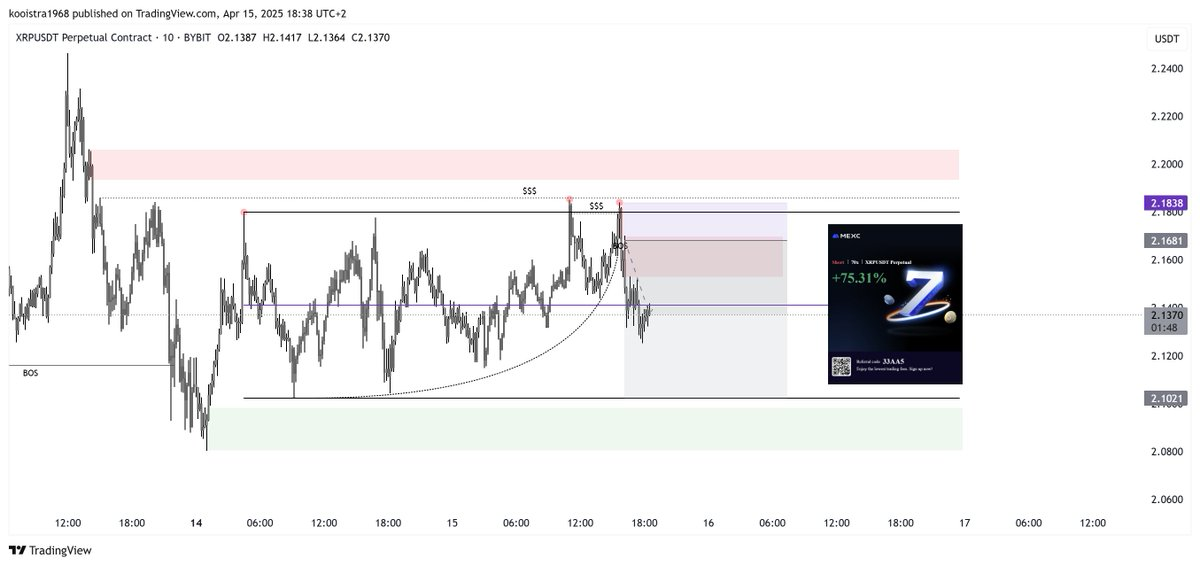
Source: X
Kooistra also noted that SHIB’s recent price movement is showing some correlation with XRP, but SHIB is currently gaining at a faster rate. This could point to stronger interest in SHIB compared to other similar tokens.
The big question now is can the token power through above the resistance zone, made up by the 22.7 trillion tokens sitting just above the present’s price. If that wall is cleared, SHIB may have room to run toward the $0.000081 target mentioned in the chart setup. For that time being, the market is still focused on that key range.


Leave a Reply