
Bitcoin traded at $88,447 on April 22, 2025, securing a market capitalization of $1.75 trillion. Over the past 24 hours, it moved within a tight range of $86,664.84 to $88,874 on a trading volume of $36.36 billion, reflecting consolidation within a prevailing uptrend.
Bitcoin
On the 1-hour chart, bitcoin exhibited a consolidative structure marked by a slight bullish tilt. Price action hovered in a low-volatility band between 87,500 and 88,800, with visible support at 87,200 to 87,400. Resistance capped gains near 88,800 to 89,000. Despite waning volume suggesting a temporary pause in momentum, the absence of aggressive selling implies that market participants largely hold positions. Entry signals are favored either on a clean breakout above 88,900 or a confirmed rebound from 87,400 with accompanying volume.
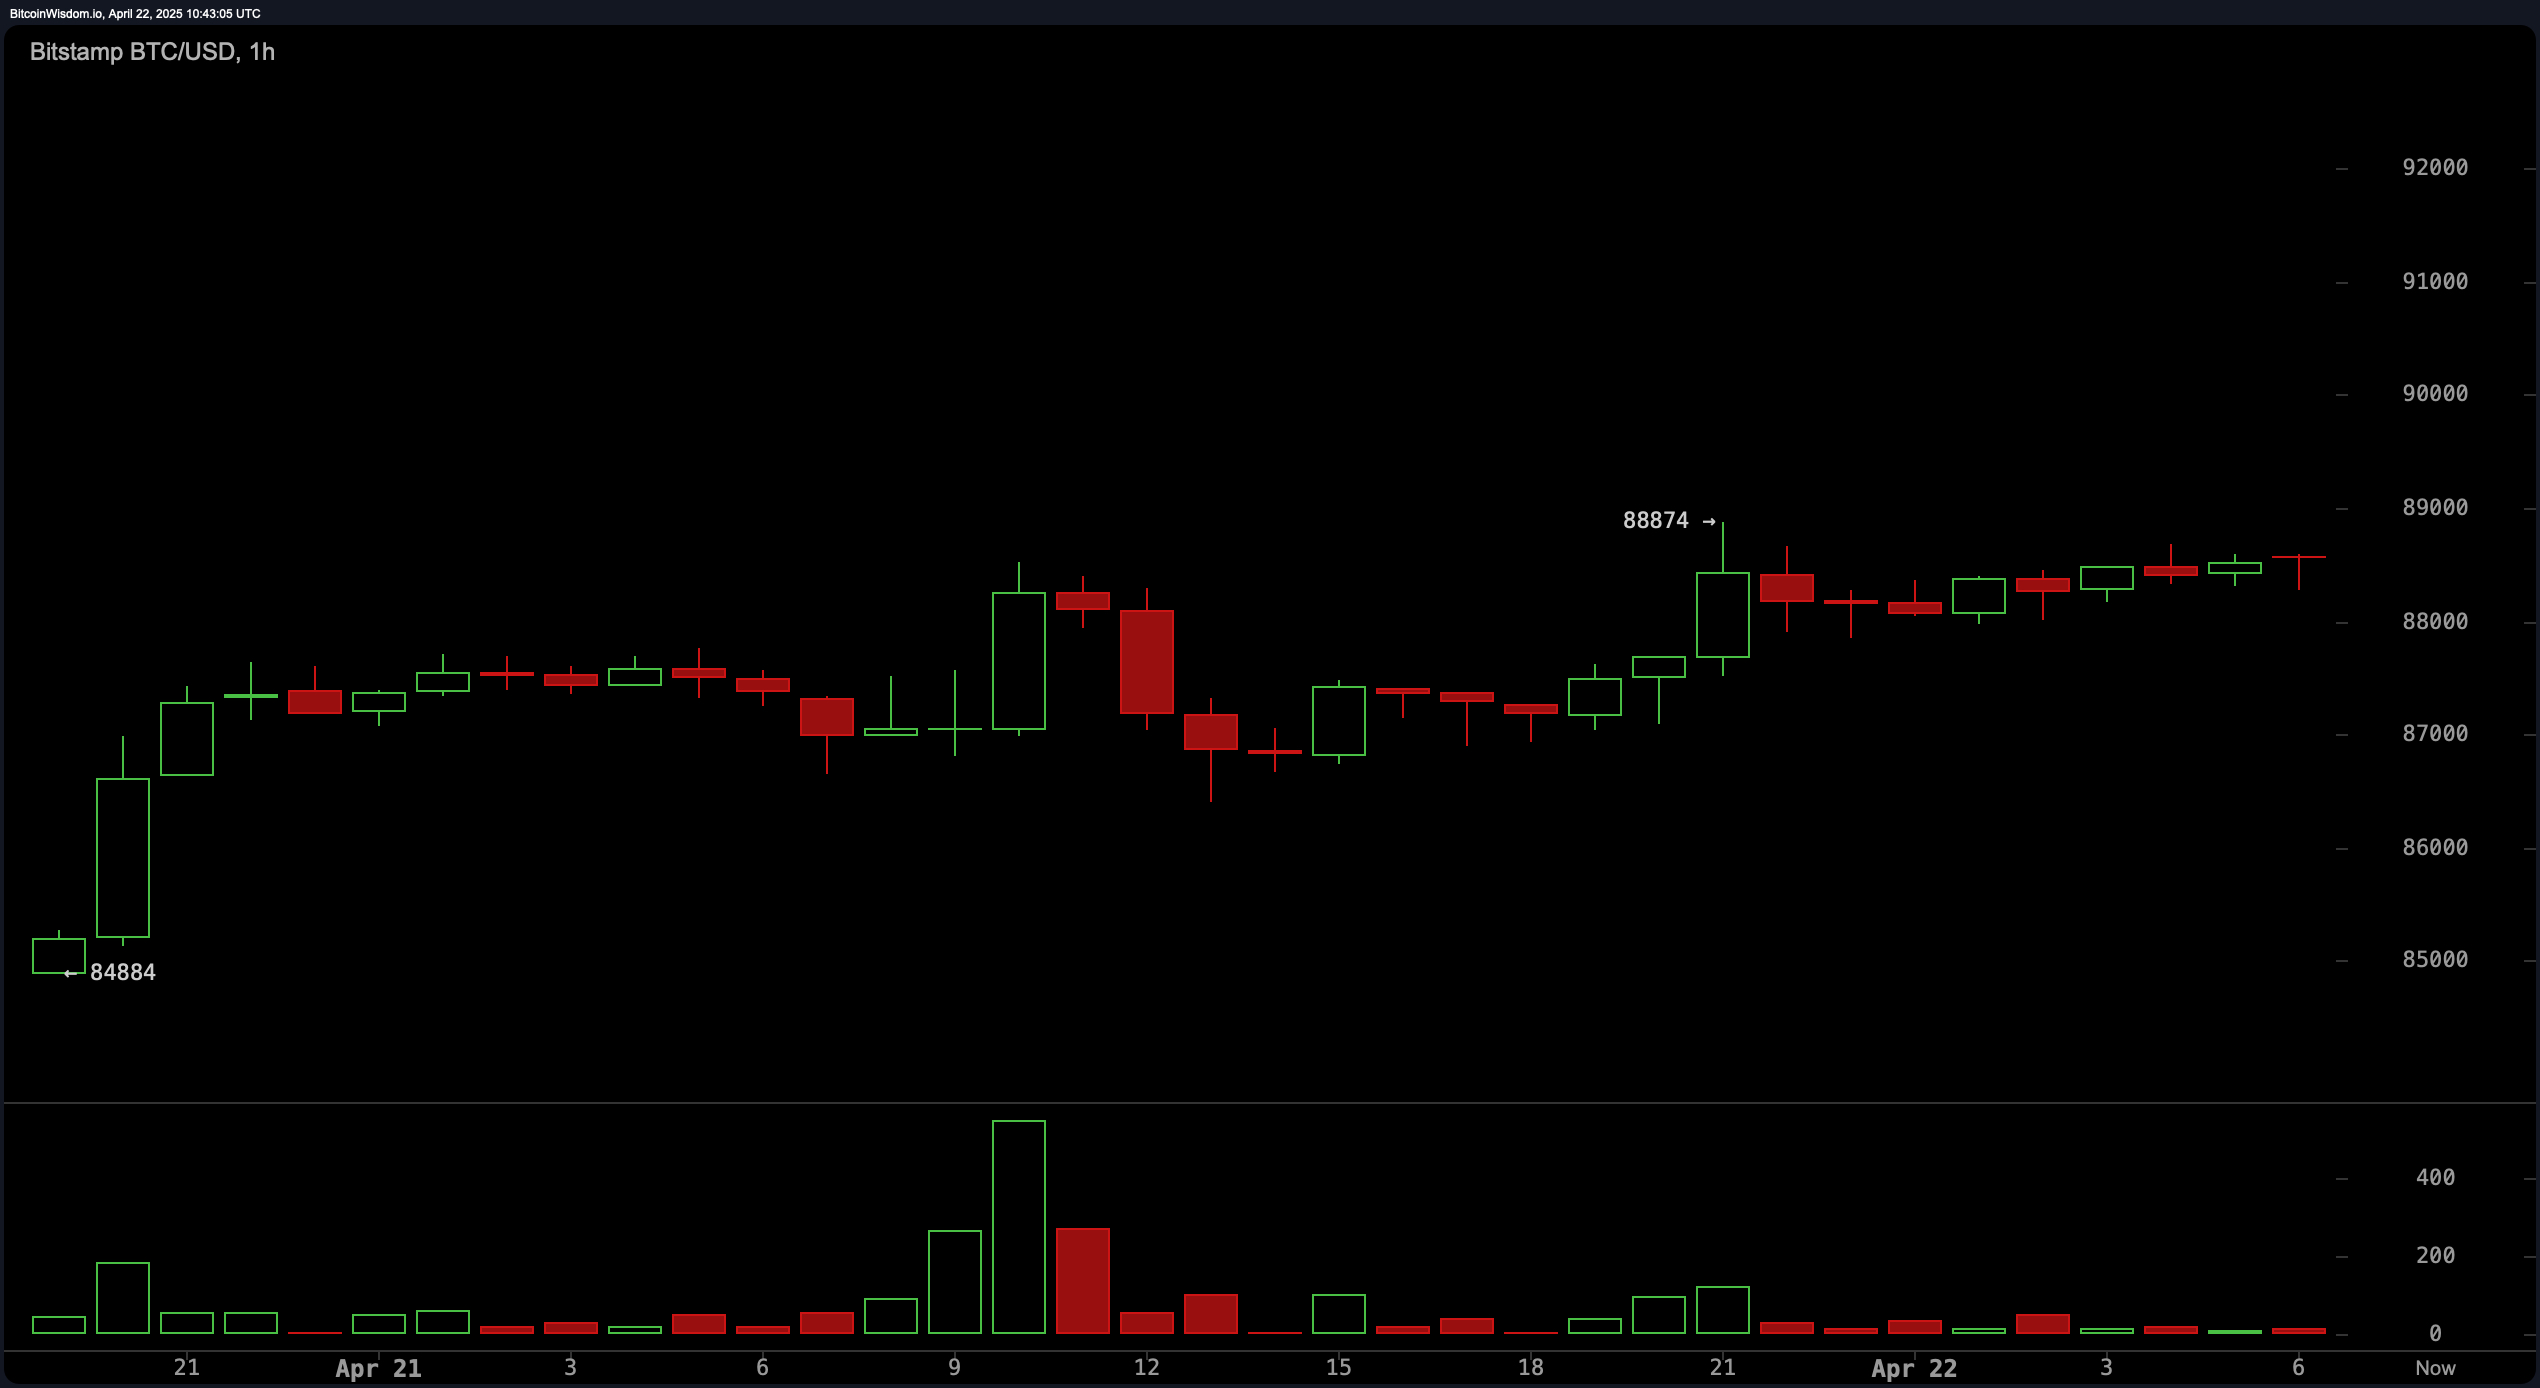
BTC/USD 1H chart on April 22.
The 4-hour chart indicated a more resolute bullish trajectory, highlighted by a resumption of upward momentum following consolidation. A breakout near 85,000 was supported by a volume surge, validating the move higher. Price structure continued to form higher lows and highs, with buyers controlling short-term swings. The immediate resistance lies in the 89,500 to 90,000 zone, while any dip toward 87,000 to 87,500 is seen as an opportunity for accumulation within the ongoing trend.
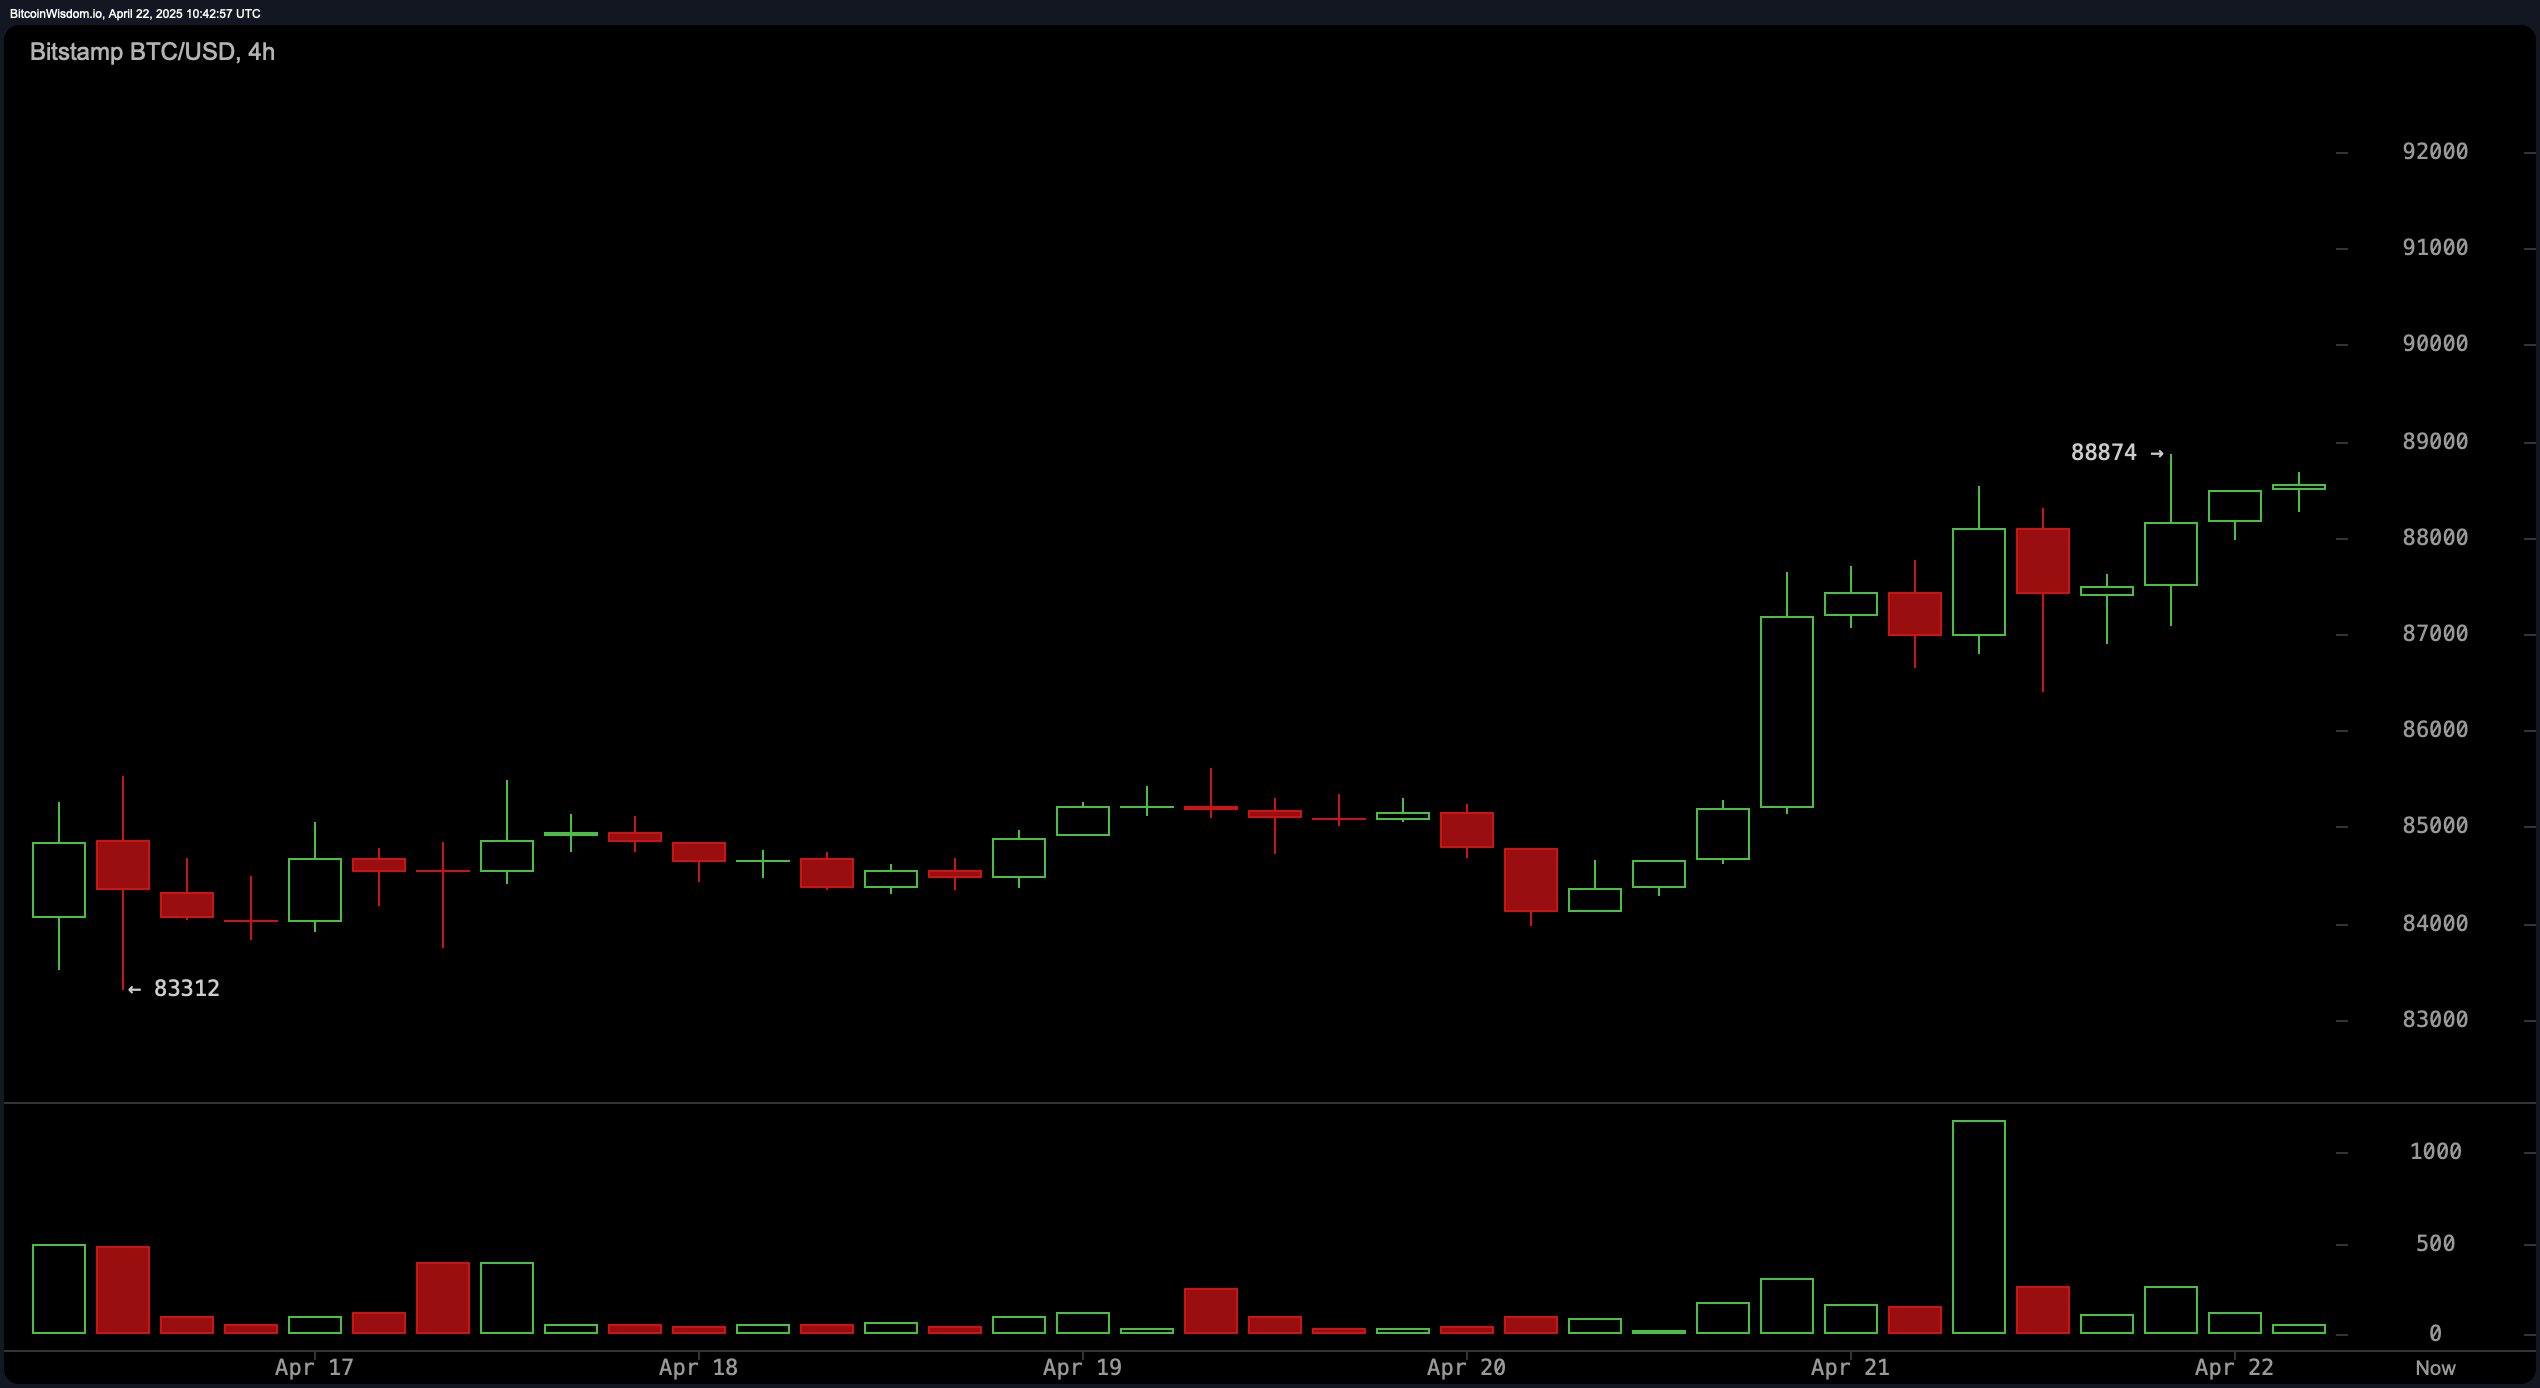
BTC/USD 4H chart on April 22.
Bitcoin‘s daily chart further reinforced a medium-term bullish bias. A sharp V-shaped recovery from a recent low of 74,434 has propelled prices into the current range, with full-bodied green candles denoting strong buyer conviction. Momentum has reclaimed prior resistance levels in the 84,000 to 85,000 zone, which now serve as new support. Despite moderate volume, the technical pattern supports continued upside, though traders should be cautious of the psychological barrier near 89,000 to 90,000, where prior rejections occurred.
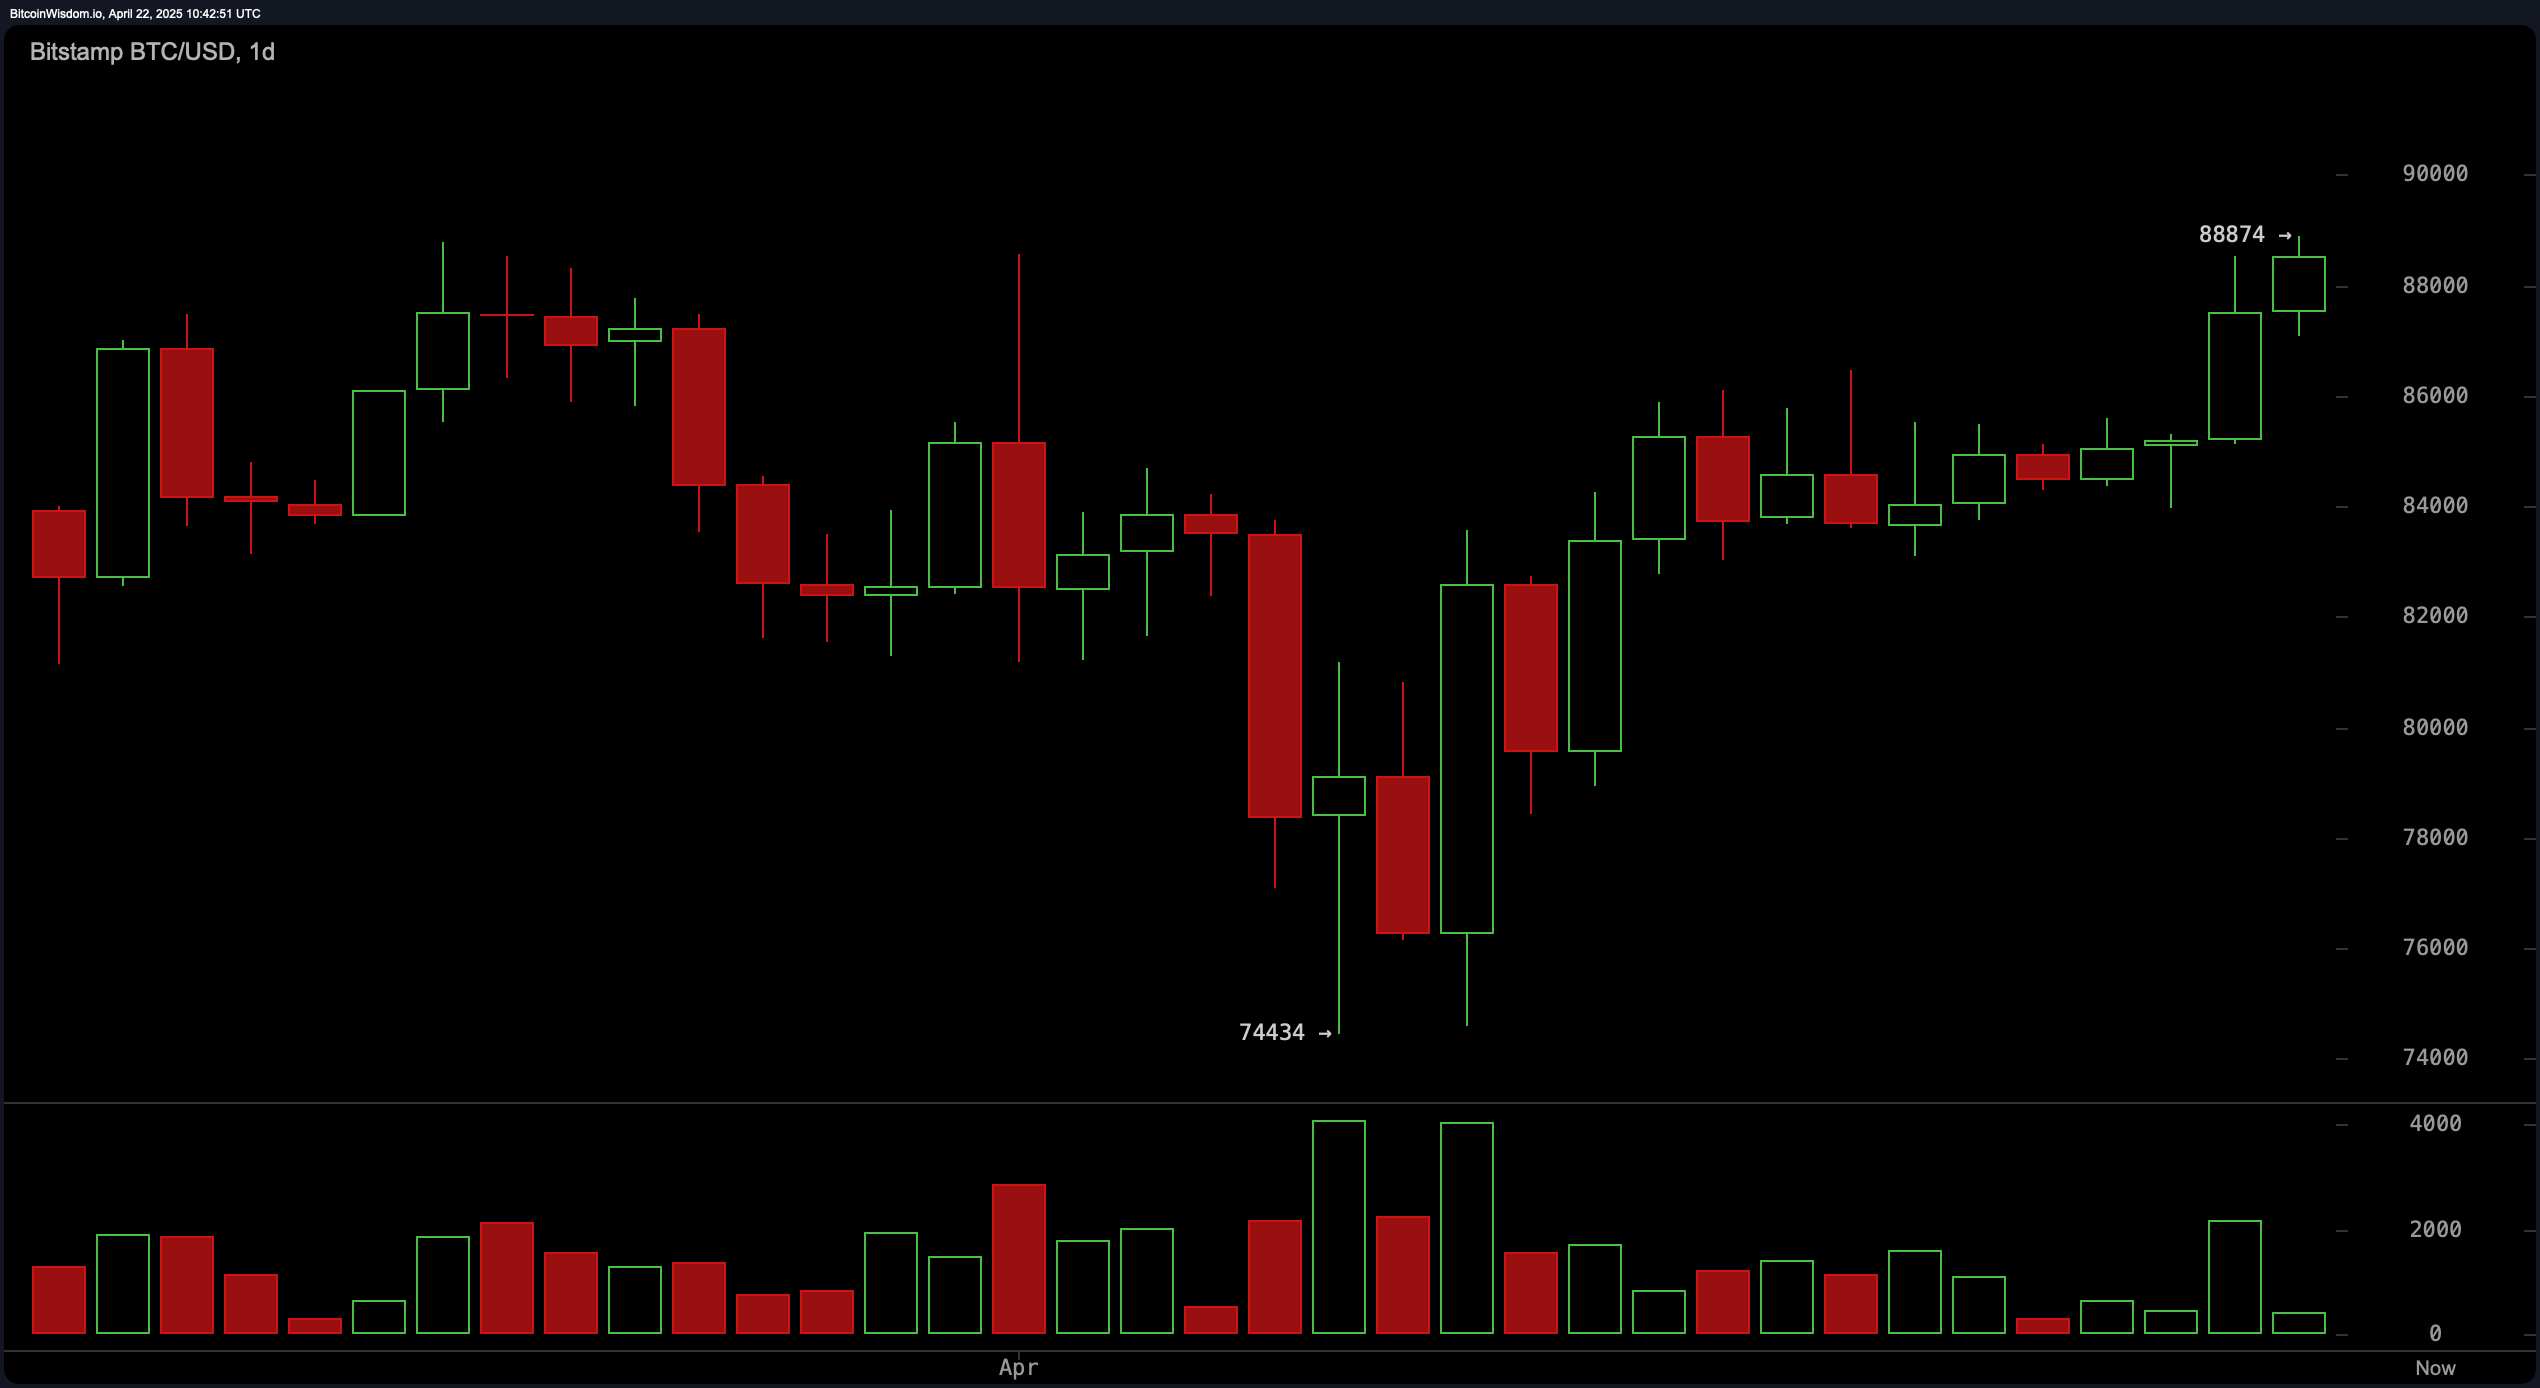
BTC/USD 1D chart on April 22.
The oscillators largely conveyed neutrality. The relative strength index (RSI) stood at 60, the Stochastic at 93, and the commodity channel index (CCI) at 153—all signaling a market neither overbought nor oversold. The average directional index (ADX) at 15 indicated a weak trend strength, while the Awesome oscillator showed a modest positive bias. The momentum indicator, however, flashed a sell at 3,268, possibly pointing to waning short-term velocity. In contrast, the moving average convergence divergence (MACD) posted a buy signal at 696, suggesting underlying bullish sentiment.
Moving averages remained decisively bullish across all durations except for the 100-period simple moving average (SMA), which issued a negative signal at 90,834—above current price levels. All exponential moving averages (EMA) from the 10 to 200-period range, along with nearly all corresponding simple moving averages, registered bullish signals. This alignment indicates strong trend support and highlights the strength of the ongoing uptrend, especially with the 200-period simple moving average acting as dynamic support around 88,358.
Bull Verdict:
Bitcoin continues to exhibit strong structural integrity across multiple timeframes, with bullish signals from nearly all exponential and simple moving averages. The breakout momentum on the 4-hour chart, combined with the supportive daily pattern and buy signal from the moving average convergence divergence (MACD), reinforces the likelihood of further upside. As long as bitcoin holds above the 87,000 threshold, a push toward the psychological 90,000 level appears within reach.
Bear Verdict:
Despite the prevailing uptrend, caution is warranted as momentum shows signs of cooling. The sell signal from the momentum oscillator and overextended stochastic readings may foreshadow a short-term pullback. Should bitcoin break below the key 87,000 support level with significant volume, it may invalidate the bullish setup and expose the price to a deeper retracement toward the 84,000–85,000 support zone.


Leave a Reply