
Solana (SOL) has climbed 13% over the past seven days, showcasing strong short-term performance. While momentum indicators like the RSI and EMA lines remain supportive, recent price action suggests that bullish strength may be stalling just below a key breakout point.
At the same time, the sharp drop in BBTrend indicates weakening trend strength and fading volatility, often a sign of incoming consolidation or market indecision. With technicals at a crossroads, SOL’s next move will likely depend on whether buyers can regain control or if a broader pullback begins to unfold.
SOL RSI Rises Sharply, but Pause in Momentum Signals Caution
Solana’s Relative Strength Index (RSI) is currently at 60.35, marking a noticeable rise from 45 just two days ago.
This jump signals growing bullish momentum, although the RSI has remained stable since yesterday, suggesting that upward pressure may be easing for now.
The increase reflects renewed buying interest in recent sessions, pushing SOL closer to overbought territory but not quite there yet. This leveling off could indicate that the market is taking a breather before deciding its next move.
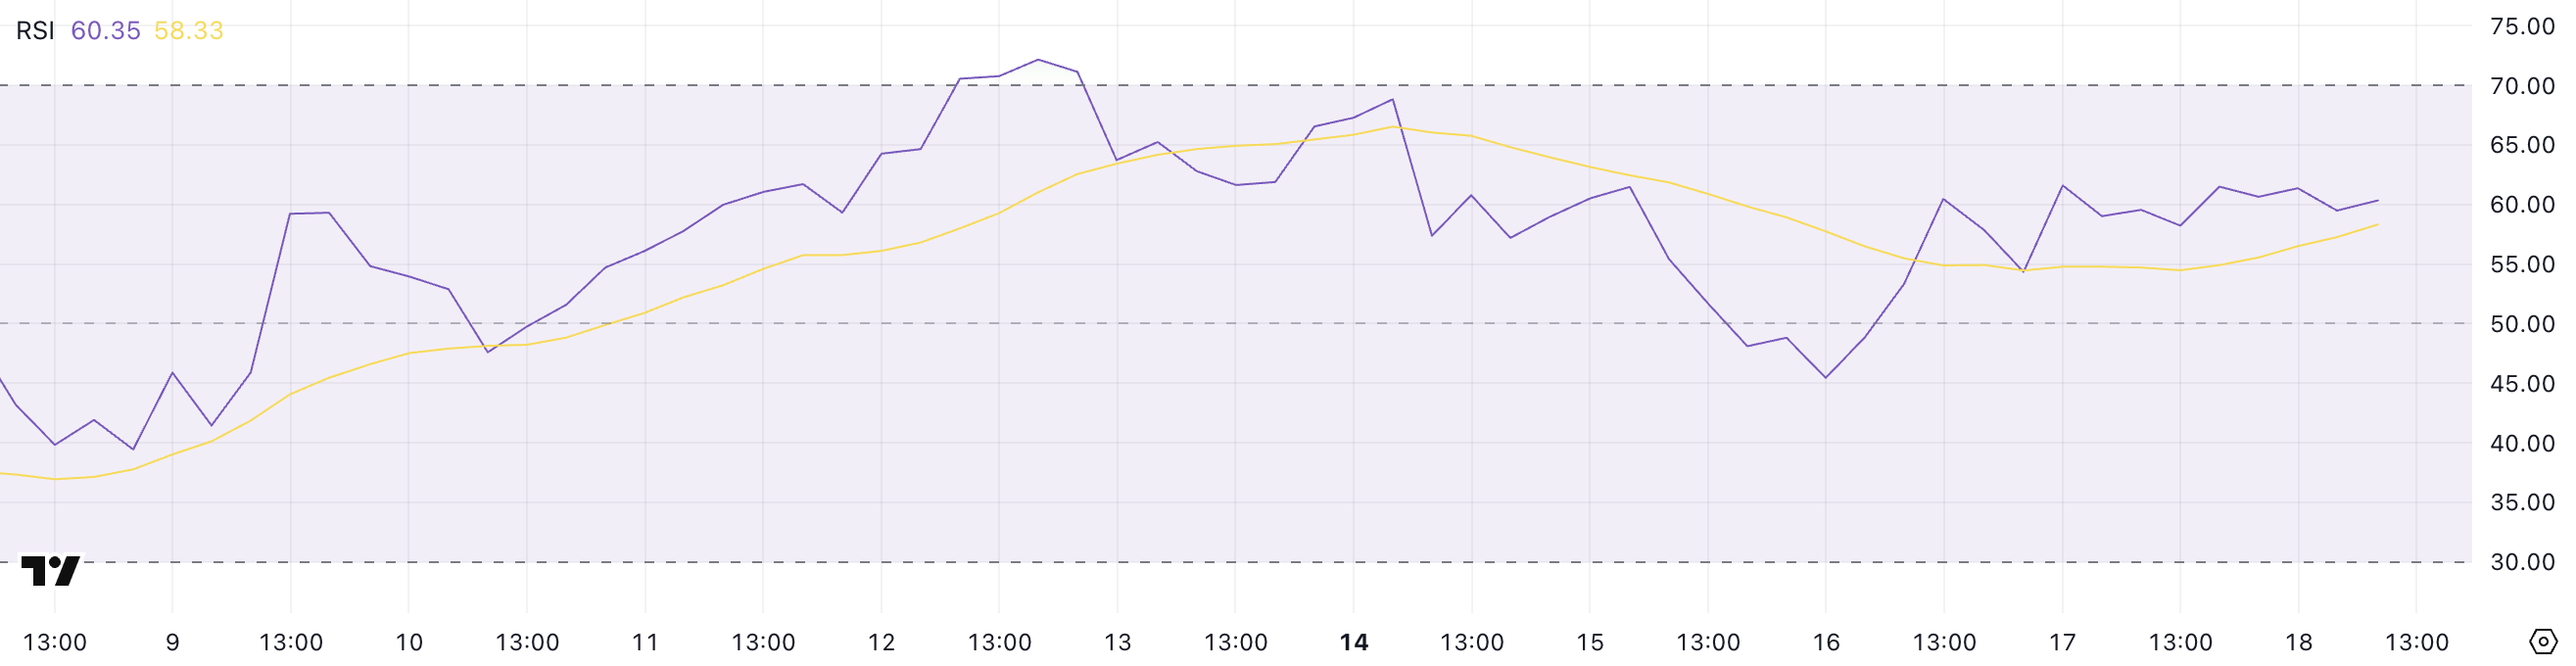
The RSI is a momentum oscillator that measures the speed and magnitude of price movements, ranging from 0 to 100. Values above 70 typically indicate that an asset is overbought and may be due for a pullback, while readings below 30 suggest oversold conditions, potentially signaling a buying opportunity.
With Solana’s RSI at 60.35, the asset is approaching bullish territory but hasn’t yet entered an extreme zone.
This positioning suggests that while recent momentum is positive, SOL could face some short-term consolidation or resistance before continuing higher—unless strong buying interest resumes and pushes the RSI closer to overbought levels.
SOL Trend Strength Weakens as BBTrend Falls Below 6
Solana’s BBTrend indicator is currently at 5.69, a significant drop from the 17.5 reading observed just four days ago.
This sharp decline suggests that volatility around SOL’s price has cooled notably, and the strength of the prior trend is weakening.
While BBTrend doesn’t signal direction on its own, the drop indicates that the strong movement, likely bullish, has lost momentum, and SOL may be entering a phase of consolidation or uncertainty.
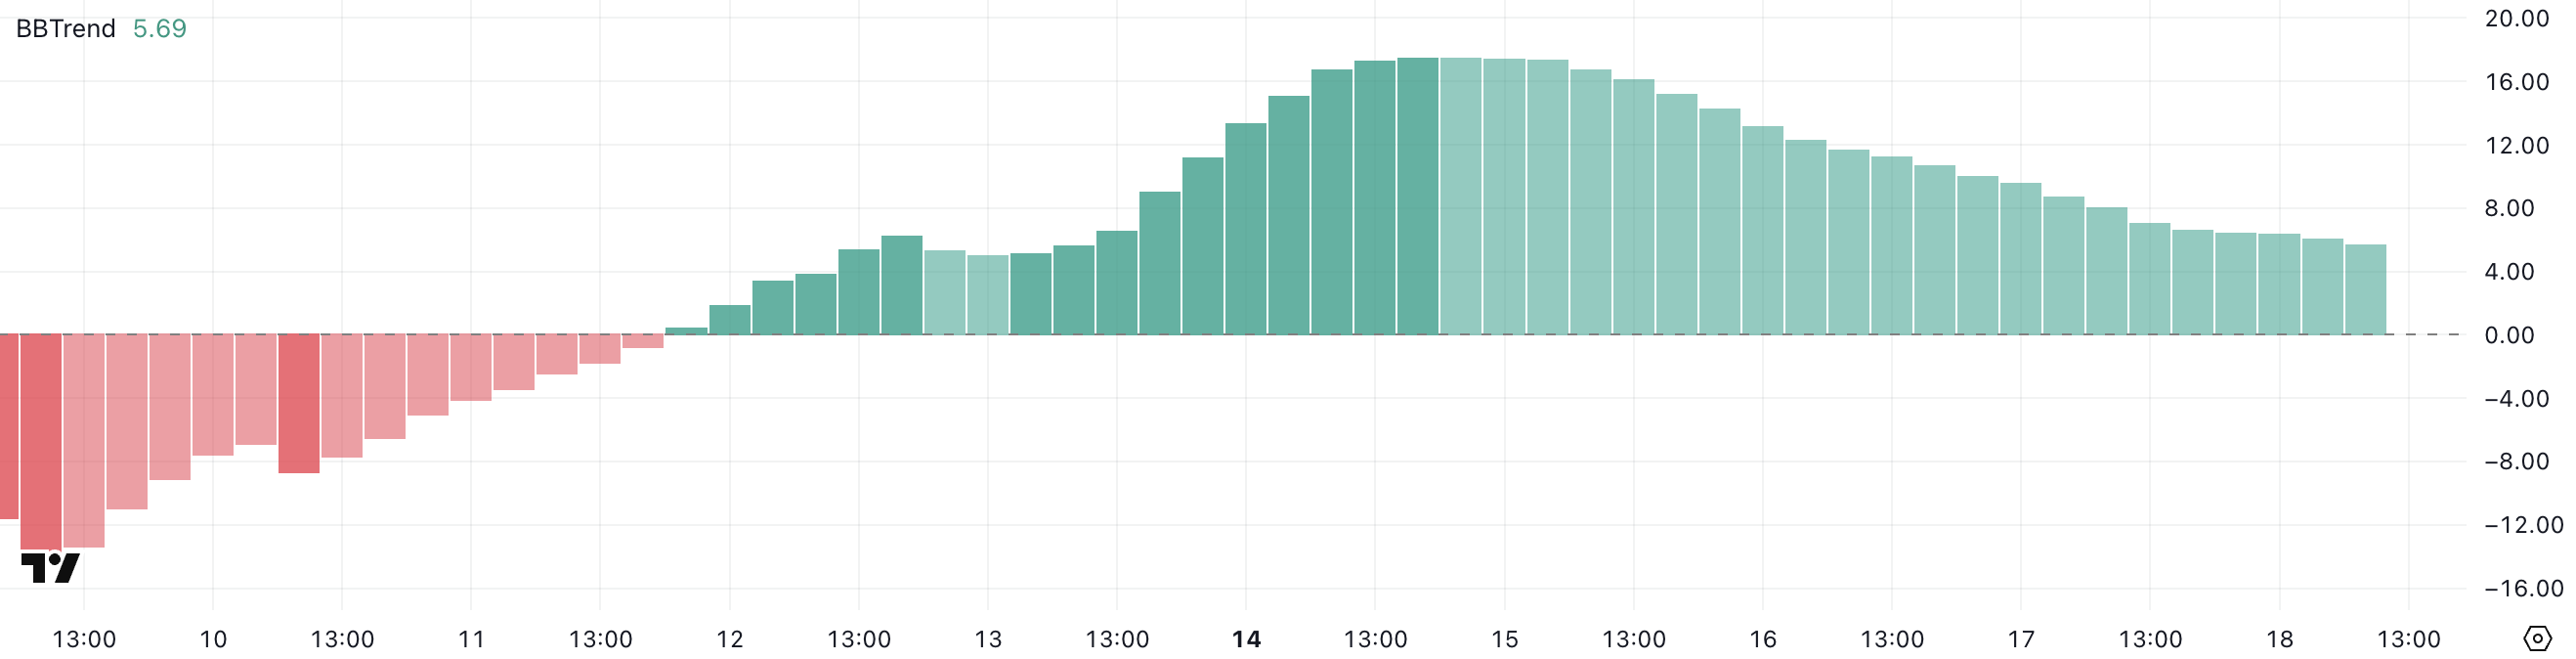
BBTrend, short for Bollinger Band Trend, measures the strength of a price trend based on the expansion or contraction of Bollinger Bands.
Higher values suggest a strong, directional move (either up or down), while lower values point to weaker trends and reduced volatility. With BBTrend now at 5.69, Solana is in a much less volatile environment, which often precedes a breakout or a reversal.
For now, this reading signals that the recent momentum is fading. Unless volatility picks up again, SOL’s price may remain range-bound in the short term.
Golden Cross Looms for SOL, But $136 Barrier Still Holding Strong
Solana’s EMA lines continue to reflect a bullish structure, with the short-term average trending above the long-term one—suggesting that positive momentum remains intact.
A potential golden cross is also forming, which, if confirmed, would further reinforce the bullish outlook.
However, despite this favorable setup, Solana price has struggled to break through the $136 resistance level over the past few days, indicating that buyers may be losing steam at this key threshold.
Tracy Jin, COO of MEXC told BeInCrypto:
“Amid widespread volatility, Solana has stood out with notable strength. A combination of favorable technical setups and institutional tailwinds — such as the launch of the first spot Solana ETFs in North America — has helped drive a short-term rally. The token’s reclaim of leadership in decentralized exchange activity and rising total value locked further support the bullish case.”
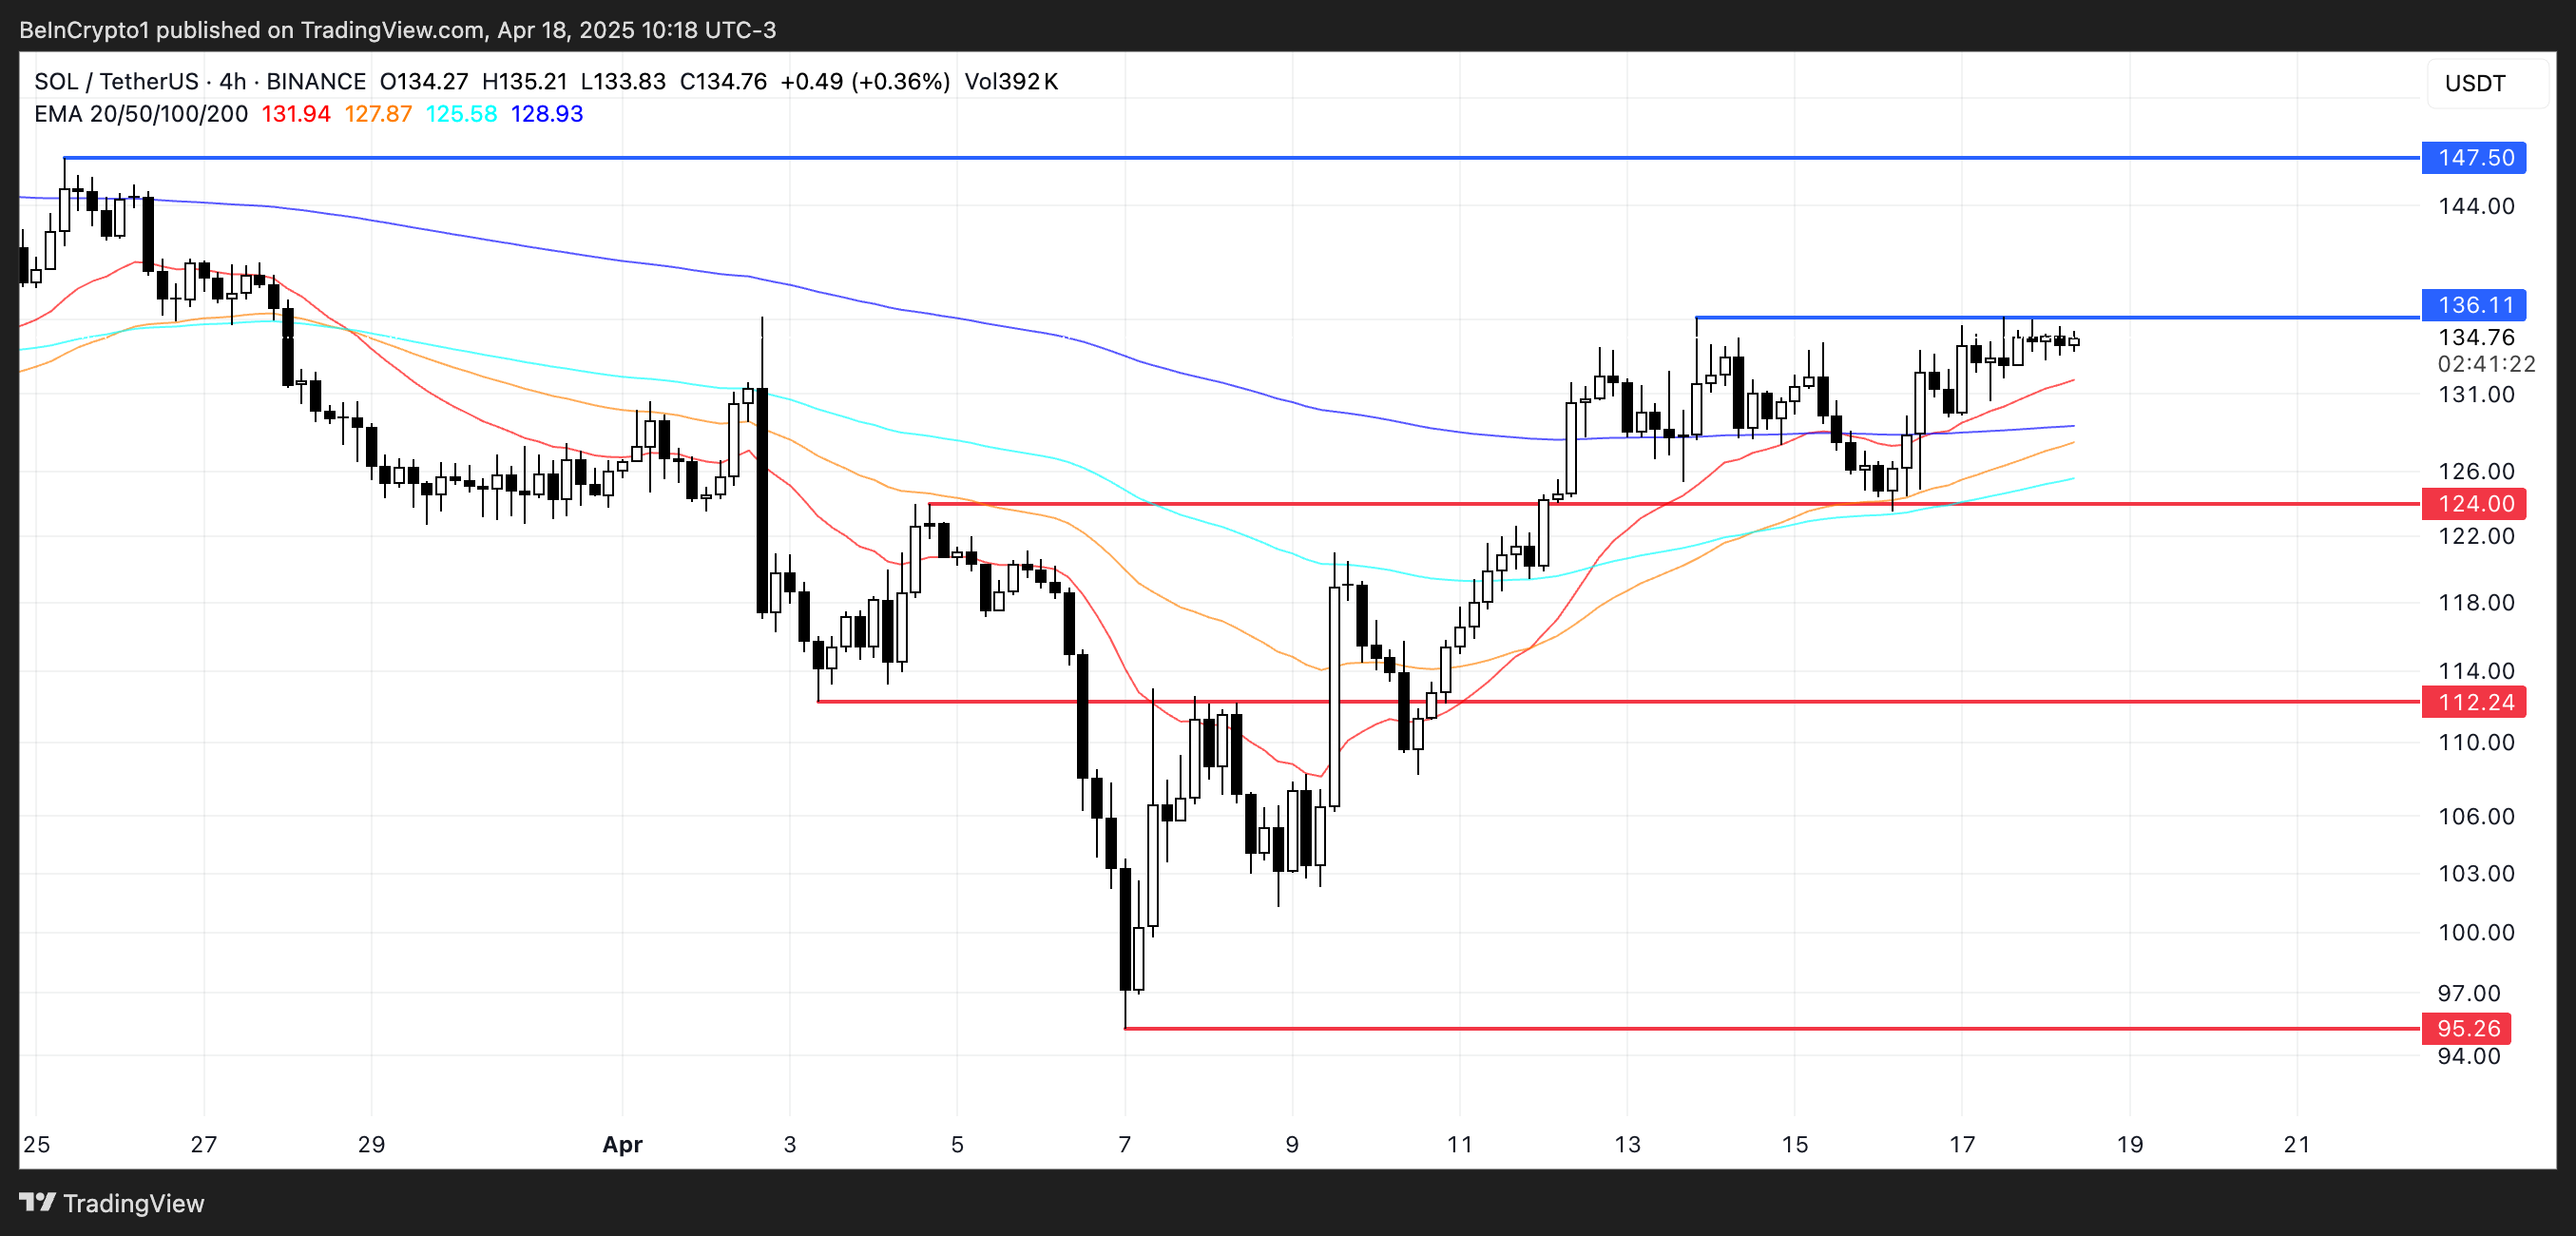
If SOL manages to push above $136 with strong volume, it could open the path toward the next targets at $147 and potentially higher. But if the current momentum fades and the price reverses, a test of support at $124 becomes likely.
About Solana next moves, Jin told BeInCrypto:
“Despite recent gains, SOL’s near-term outlook remains sensitive to broader liquidity conditions. Any deterioration in market confidence — whether from macro shocks or renewed volatility in Bitcoin — could cap upside potential.”
A breakdown below that could accelerate losses toward $112, and in the event of a deeper correction, SOL could even revisit the $95 region.