
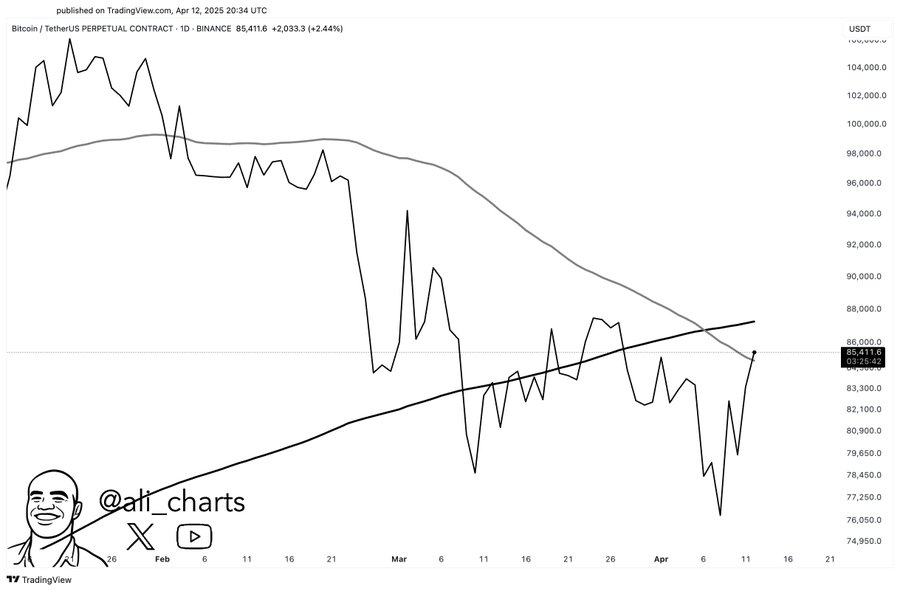
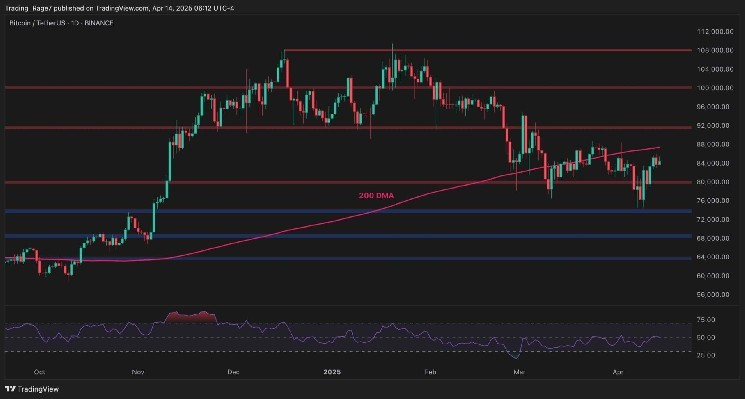
Bitcoin (BTC) price has surged through the 50-day Simple Moving Average (SMA), signaling a continuation of its bullish momentum.
The next major resistance lies at the 200-day SMA, located around $87,250.
A breakout above this resistance level could pave the way for Bitcoin to reach $94,100. This is a key target in its current price rally.
50-Day SMA Breakout Sparks Bullish Momentum
Bitcoin has recently broken through the 50-day SMA, a key technical indicator that tracks the average price over a set period.
This breakout is widely seen as a bullish signal, suggesting that Bitcoin is gaining strength and could be setting the stage for further upward movement.
Moving averages are important indicators that many traders use to analyze price trends.
When Bitcoin (BTC) price rises above a short-term moving average like the 50-day SMA, it often indicates growing momentum in the market.
Source| X
Bitcoin’s move above the 50 day SMA further means that the price of Bitcoin is being supported at higher levels after an extended period of bearish or neutral price action.
This signals a possible way to further strengthen its market value. Market participants are more bullish on Bitcoin’s short term outcomes.
Now, analysts continue to watch the next significant resistance, which is located at the 200 day SMA at $87,250.
Bitcoin (BTC) Price Key Resistance Is At 200 Day SMA At $87,250
The next challenge for Bitcoin is the old 200 SMA. Traders still use it for confirmation of the long term trend.
The Crossing the 200-day SMA is one of the most significant indicators of a shift in market sentiment.
For Bitcoin, this level is currently sitting at $87,250. A breakout above this resistance would most likely indicate an imminent very bullish phase of bitcoin.
If Bitcoin (BTC) price manages to break above the 200 day SMA, analysts expect the price to reach towards $94,100, a level that has served as resistance on several occasions.
If Bitcoin breaks this key price point, it could be the continuation of the continuation of the bull market, probably resulting in a retest of previous all time highs.
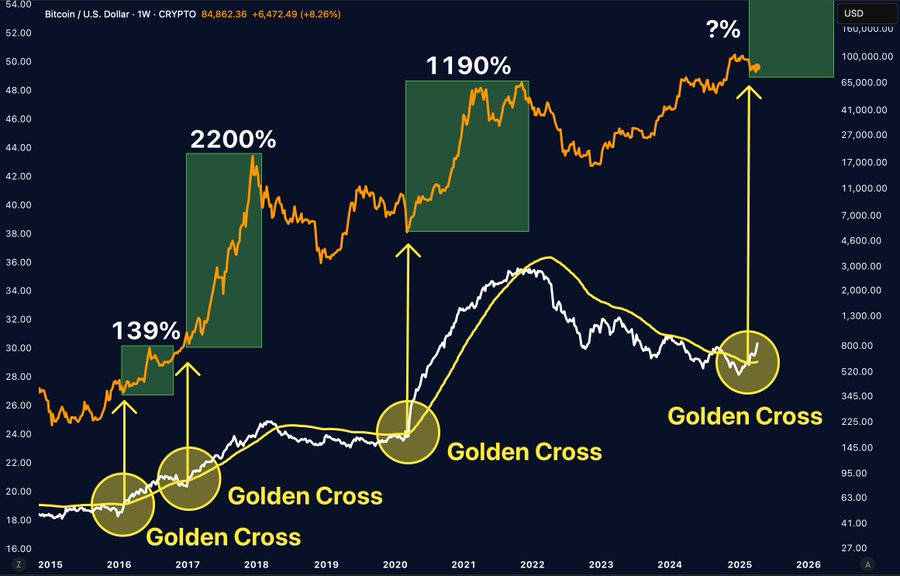
Golden Cross: A Historical Indicator of Bitcoin’s Price Surge
Moreover, the bulls were also treated to the formation of the Golden Cross on Bitcoin, a pattern that has been an accurate indicator of strong gains.
Furthermore, Bitcoin has displayed a Golden Cross, a pattern that has occasionally pointed to rosy price growth.
Source| X
A Golden Cross is when a downtrend shifts to an uptrend, and the 50 day SMA moves over the 200 day SMA.
Market analyst MerlijnTrader further pointed out that Bitcoin has increased in price following each previous Golden Cross in 2016, 2017, and 2020, up 139%, 116%, and 1190% respectively.
Recently, yet another Golden Cross formed in Bitcoin and it is possible that the price of BTC could start rising.
Based on history, if it indicates anything, analysts expect a significant rise for Bitcoin in the next few months with a large potential rise.
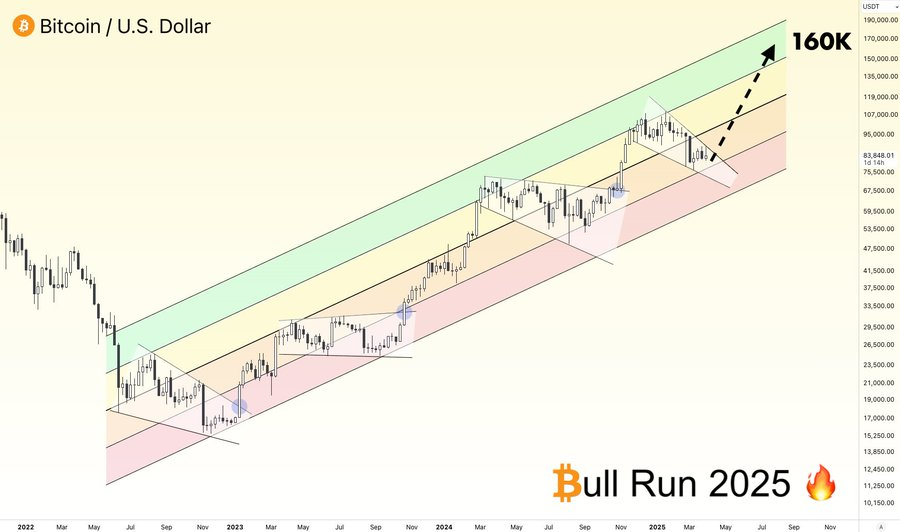
BTC Future Price Projections: Targeting $160,000 by 2026
Bitcoin’s potential price movement has also been weighed in on by market analyst 0xChiefy. 0xChiefy’s chart shows Bitcoin’s price data in many color coded channels showing each stage of the market cycle.
Bitcoin has remained within these channels, consistently finding support at lower levels and resistance at higher levels.
Based on this cycle, Bitcoin’s (BTC) price is currently positioned near $85,000–$88,000, close to the upper part of the yellow channel.
Source| X
According to 0xChiefy, Bitcoin could easily hit $160k in the next 12 months with a chance of going higher.
Its historical price cycles have typically peaked one year after the halving event, which BTC is expected to experience in 2025.
According to the cycle pattern of previous years, Bitcoin will follow the same pattern which will make BTC enter into main bull run till 2025 and BTC will keep rising in 2026.
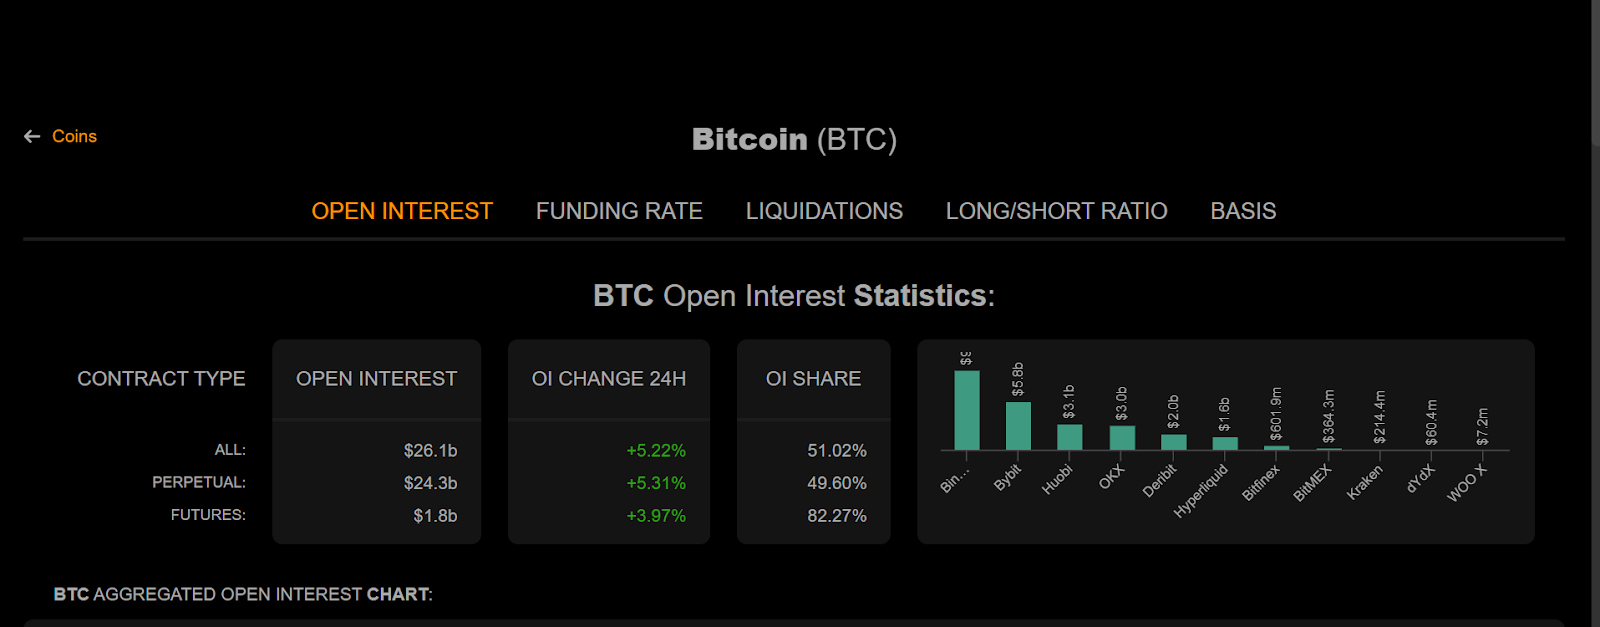
Bitcoin’s Open Interest Growth: Signaling Increased Market Participation
However, Bitcoin’s open interest also surged 5.22% in the last 24 hours. The open interest is also increasing meaning traders are going long with expectations of upcoming large price movements.
Source| coinalyze
Such a spike could be an indication that Bitcoin (BTC) price’s current bullish trend has the support of growing confidence in the market and that further price movements could take place as market participants react and adjust their positions.


Leave a Reply