BNB is above the $540 support but below the moving average lines in a trading range.
BNB price long-term prediction: bearish
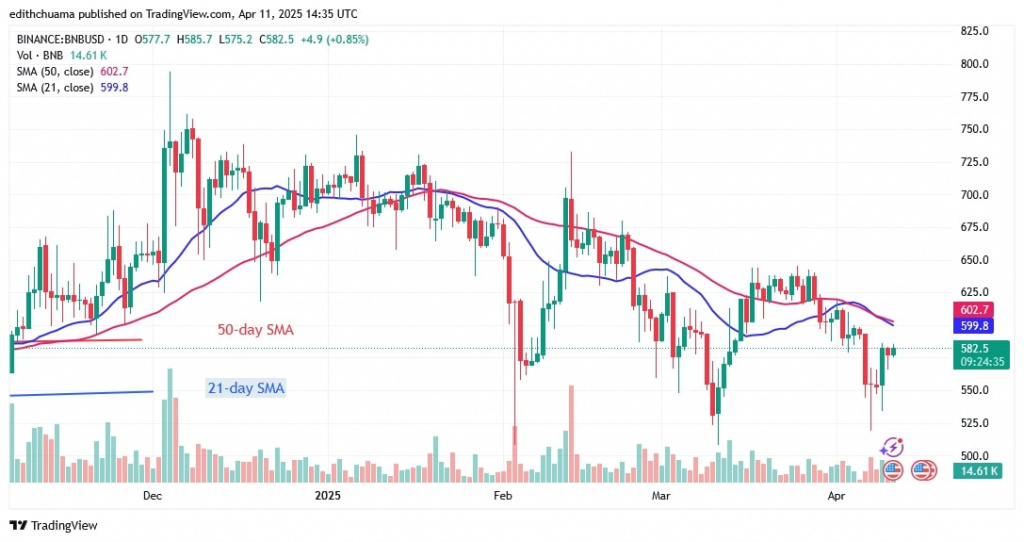
The price is correcting upwards to retest the $590 high, which is now resistance. The uptrend has stalled in the middle of the price range. BNB price lost its $590 support as it fell to a low of $518, but bulls quickly bought the dips as the altcoin rallied above the $540 support.
On the upside, BNB will return to its uptrend if it breaks the $590 level and the moving average lines. BNB will reach the next resistance level at $640. The market will fall below $460 if BNB falls and breaks the current support level at $540. BNB is at $582.50.
BNB price indicator reading
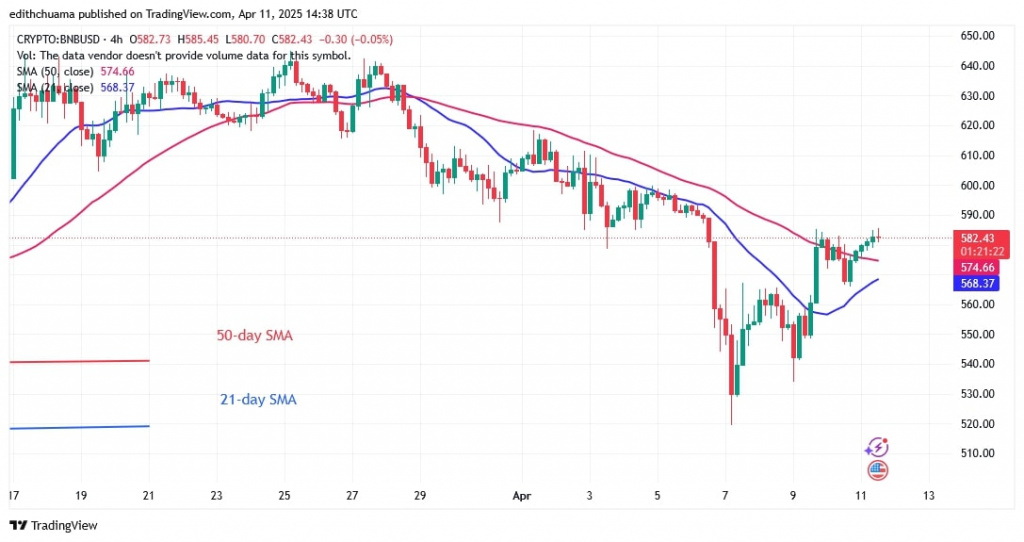
The price bars on the 4-hour chart are above the moving average lines. The $590 barrier prevented BNB from rising. The price bars on the daily chart are still below the moving average lines, suggesting that BNB is under selling pressure.
Technical indicators:
Key Resistance Levels – $600, $650, $700
Key Support Levels – $400, $350, $300
What is the next direction for BNB/USD?
BNB has stalled below the $590 high, which is currently resistance, but above the $540 support. The initial uptrend ends at a high of $582.50.
However, BNB will decline if it fails to clear the first hurdle at $586. However, if the support at $540 holds, BNB will begin a range-bound move.
Disclaimer. This analysis and forecast are the personal opinions of the author. They are not a recommendation to buy or sell cryptocurrency and should not be viewed as an endorsement by CoinIdol.com. Readers should do their research before investing in funds.




Leave a Reply