
Bitcoin opened on April 12, 2025, trading between $83,583 and $83,856, with a market capitalization of $1.65 trillion and a 24-hour trading volume of $29.74 billion. Intraday price movements ranged between $81,675 and $84,056, signaling a session marked by measured volatility and consolidation across multiple timeframes.
Bitcoin
Across the hourly chart, bitcoin ( BTC) traded within a narrow band from approximately $83,000 to $84,200. Price action showed signs of compression following a previous bullish impulse from $78,965 to $84,257. This move has since cooled, with diminishing volume hinting at declining short-term momentum. A breakout above $84,200 could potentially initiate a new leg upward, while a breakdown below $83,000 might trigger local bearish sentiment. The hourly setup favors range-based trading with well-defined stop-loss parameters.
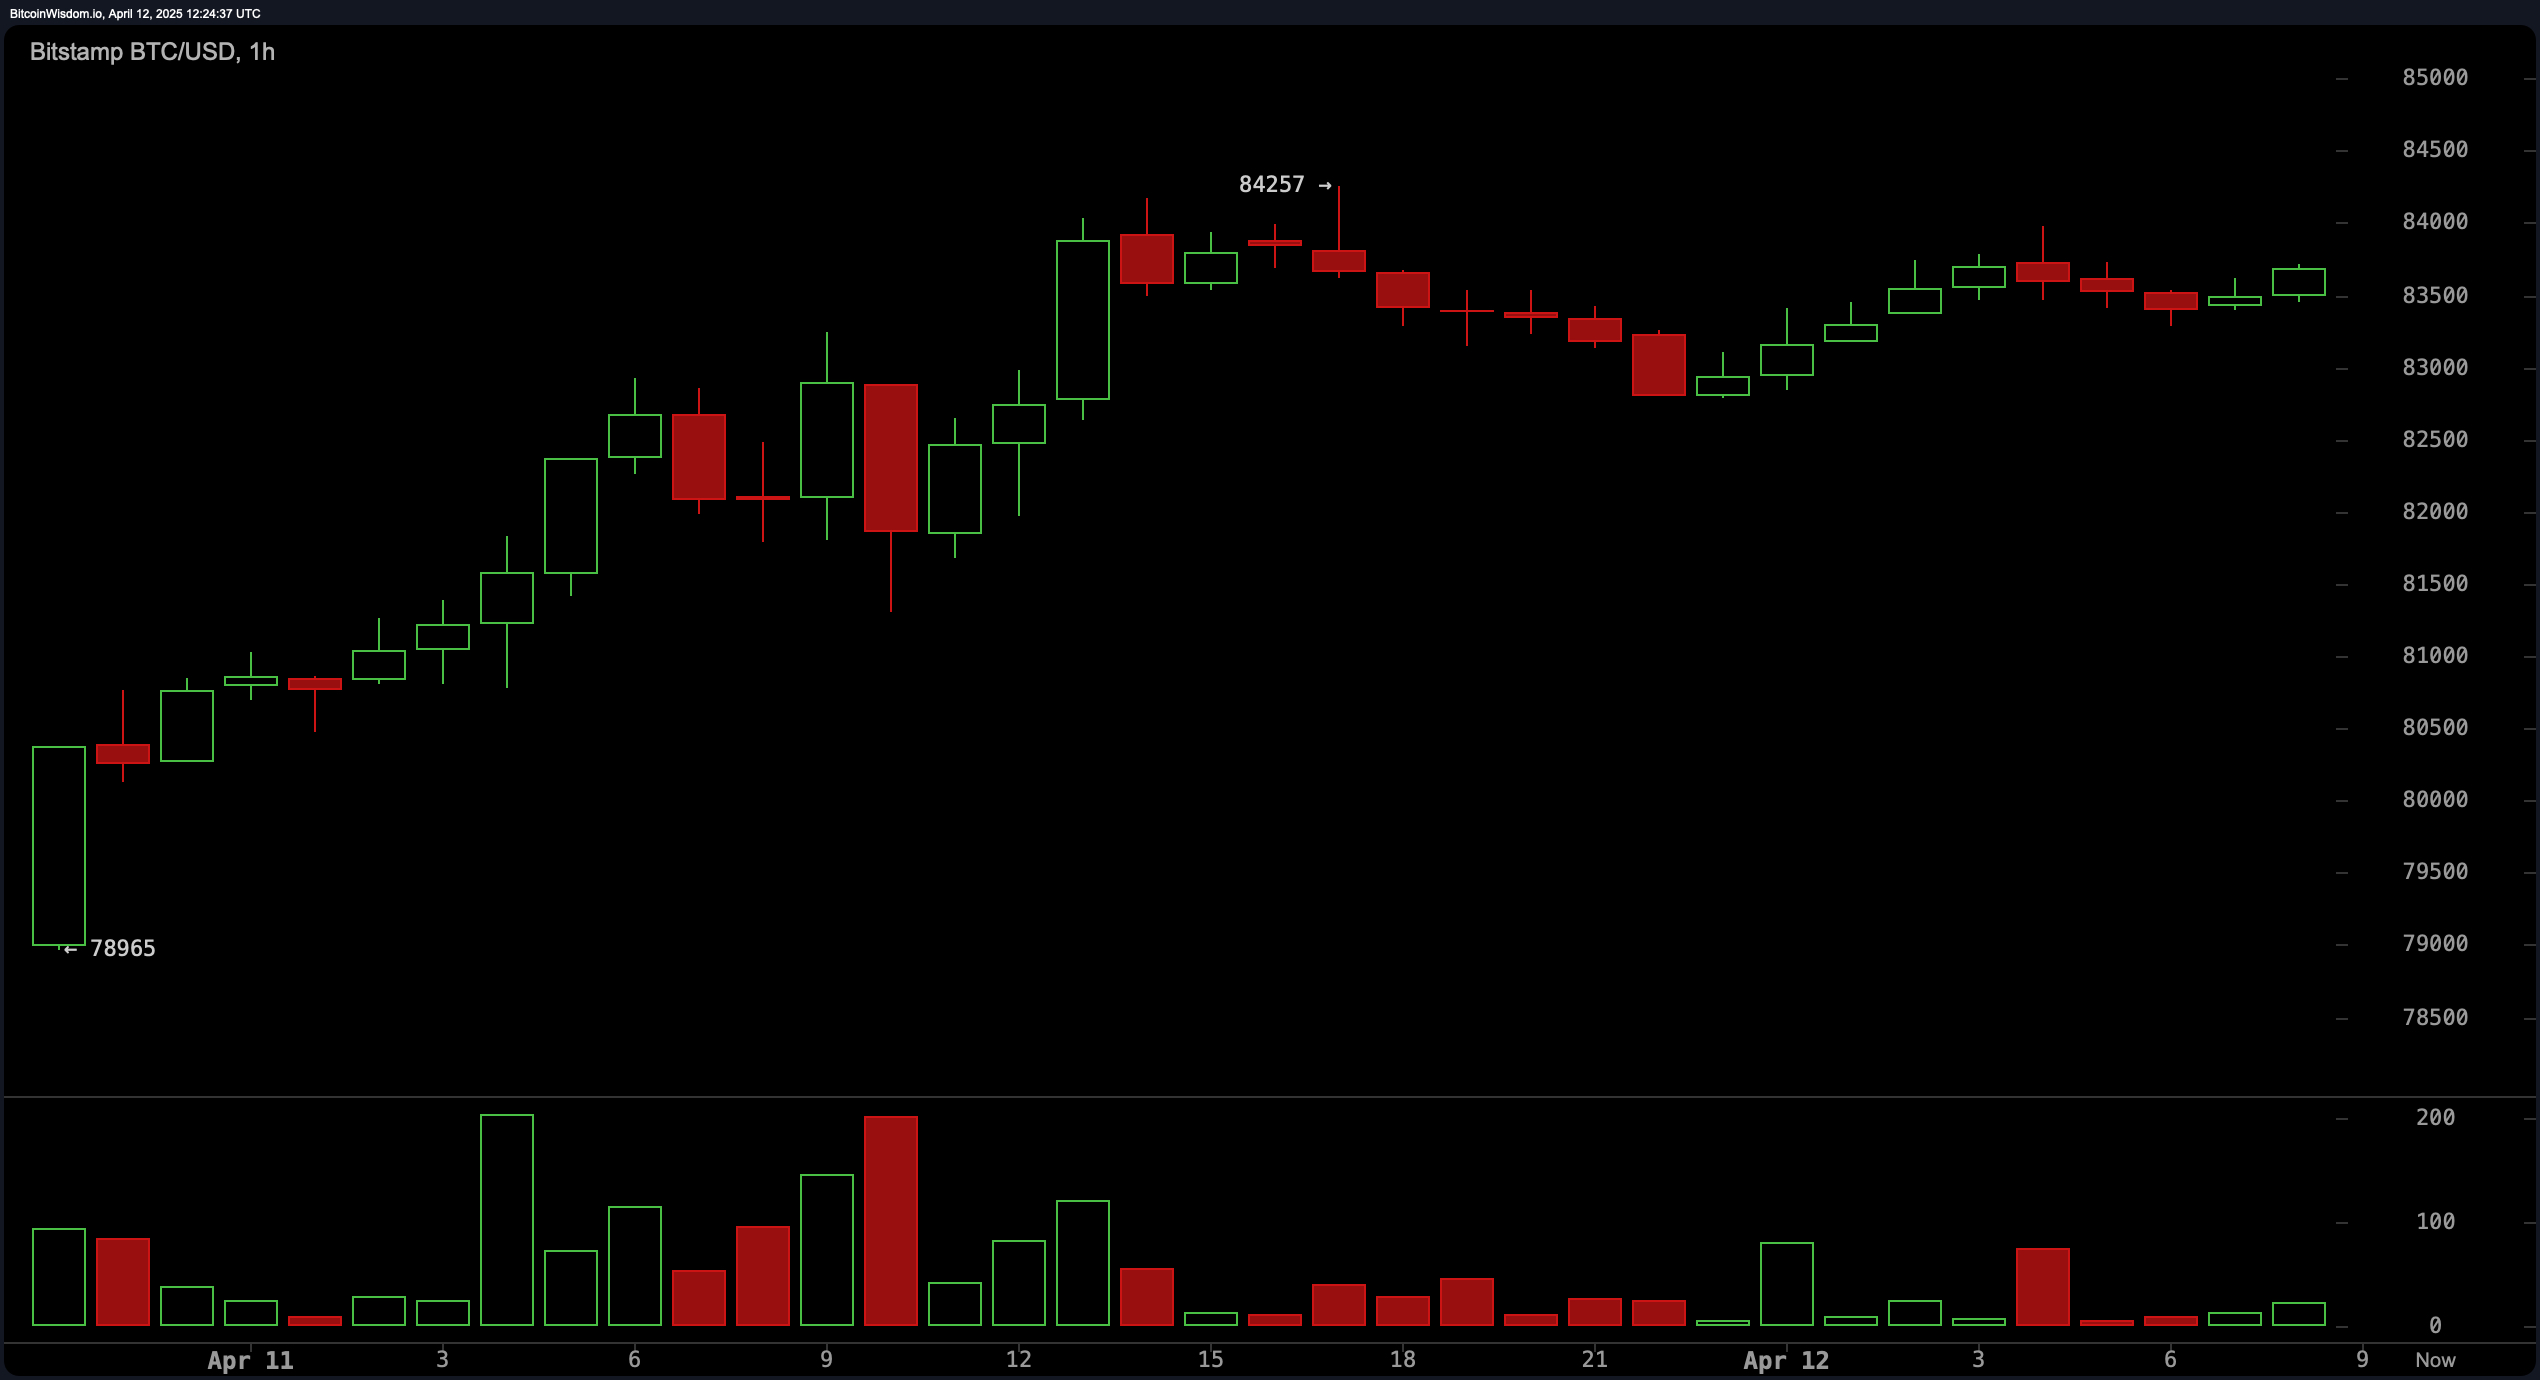
BTC/USD 1H chart via Bitstamp on April 12, 2025.
On the 4-hour chart, the structure indicates a bullish bias, supported by a V-shaped recovery from the recent low of $74,434. Bitcoin has been forming higher lows amid low-volume consolidation, suggesting that bulls are gradually absorbing selling pressure. Resistance at $84,500 remains pivotal, and a sustained breakout could target the $87,000 to $88,000 zone. Conversely, failure to break higher may lead to a retest of the $80,000 to $81,000 support region. Traders are advised to closely monitor volume surges and candle patterns for breakout confirmation.
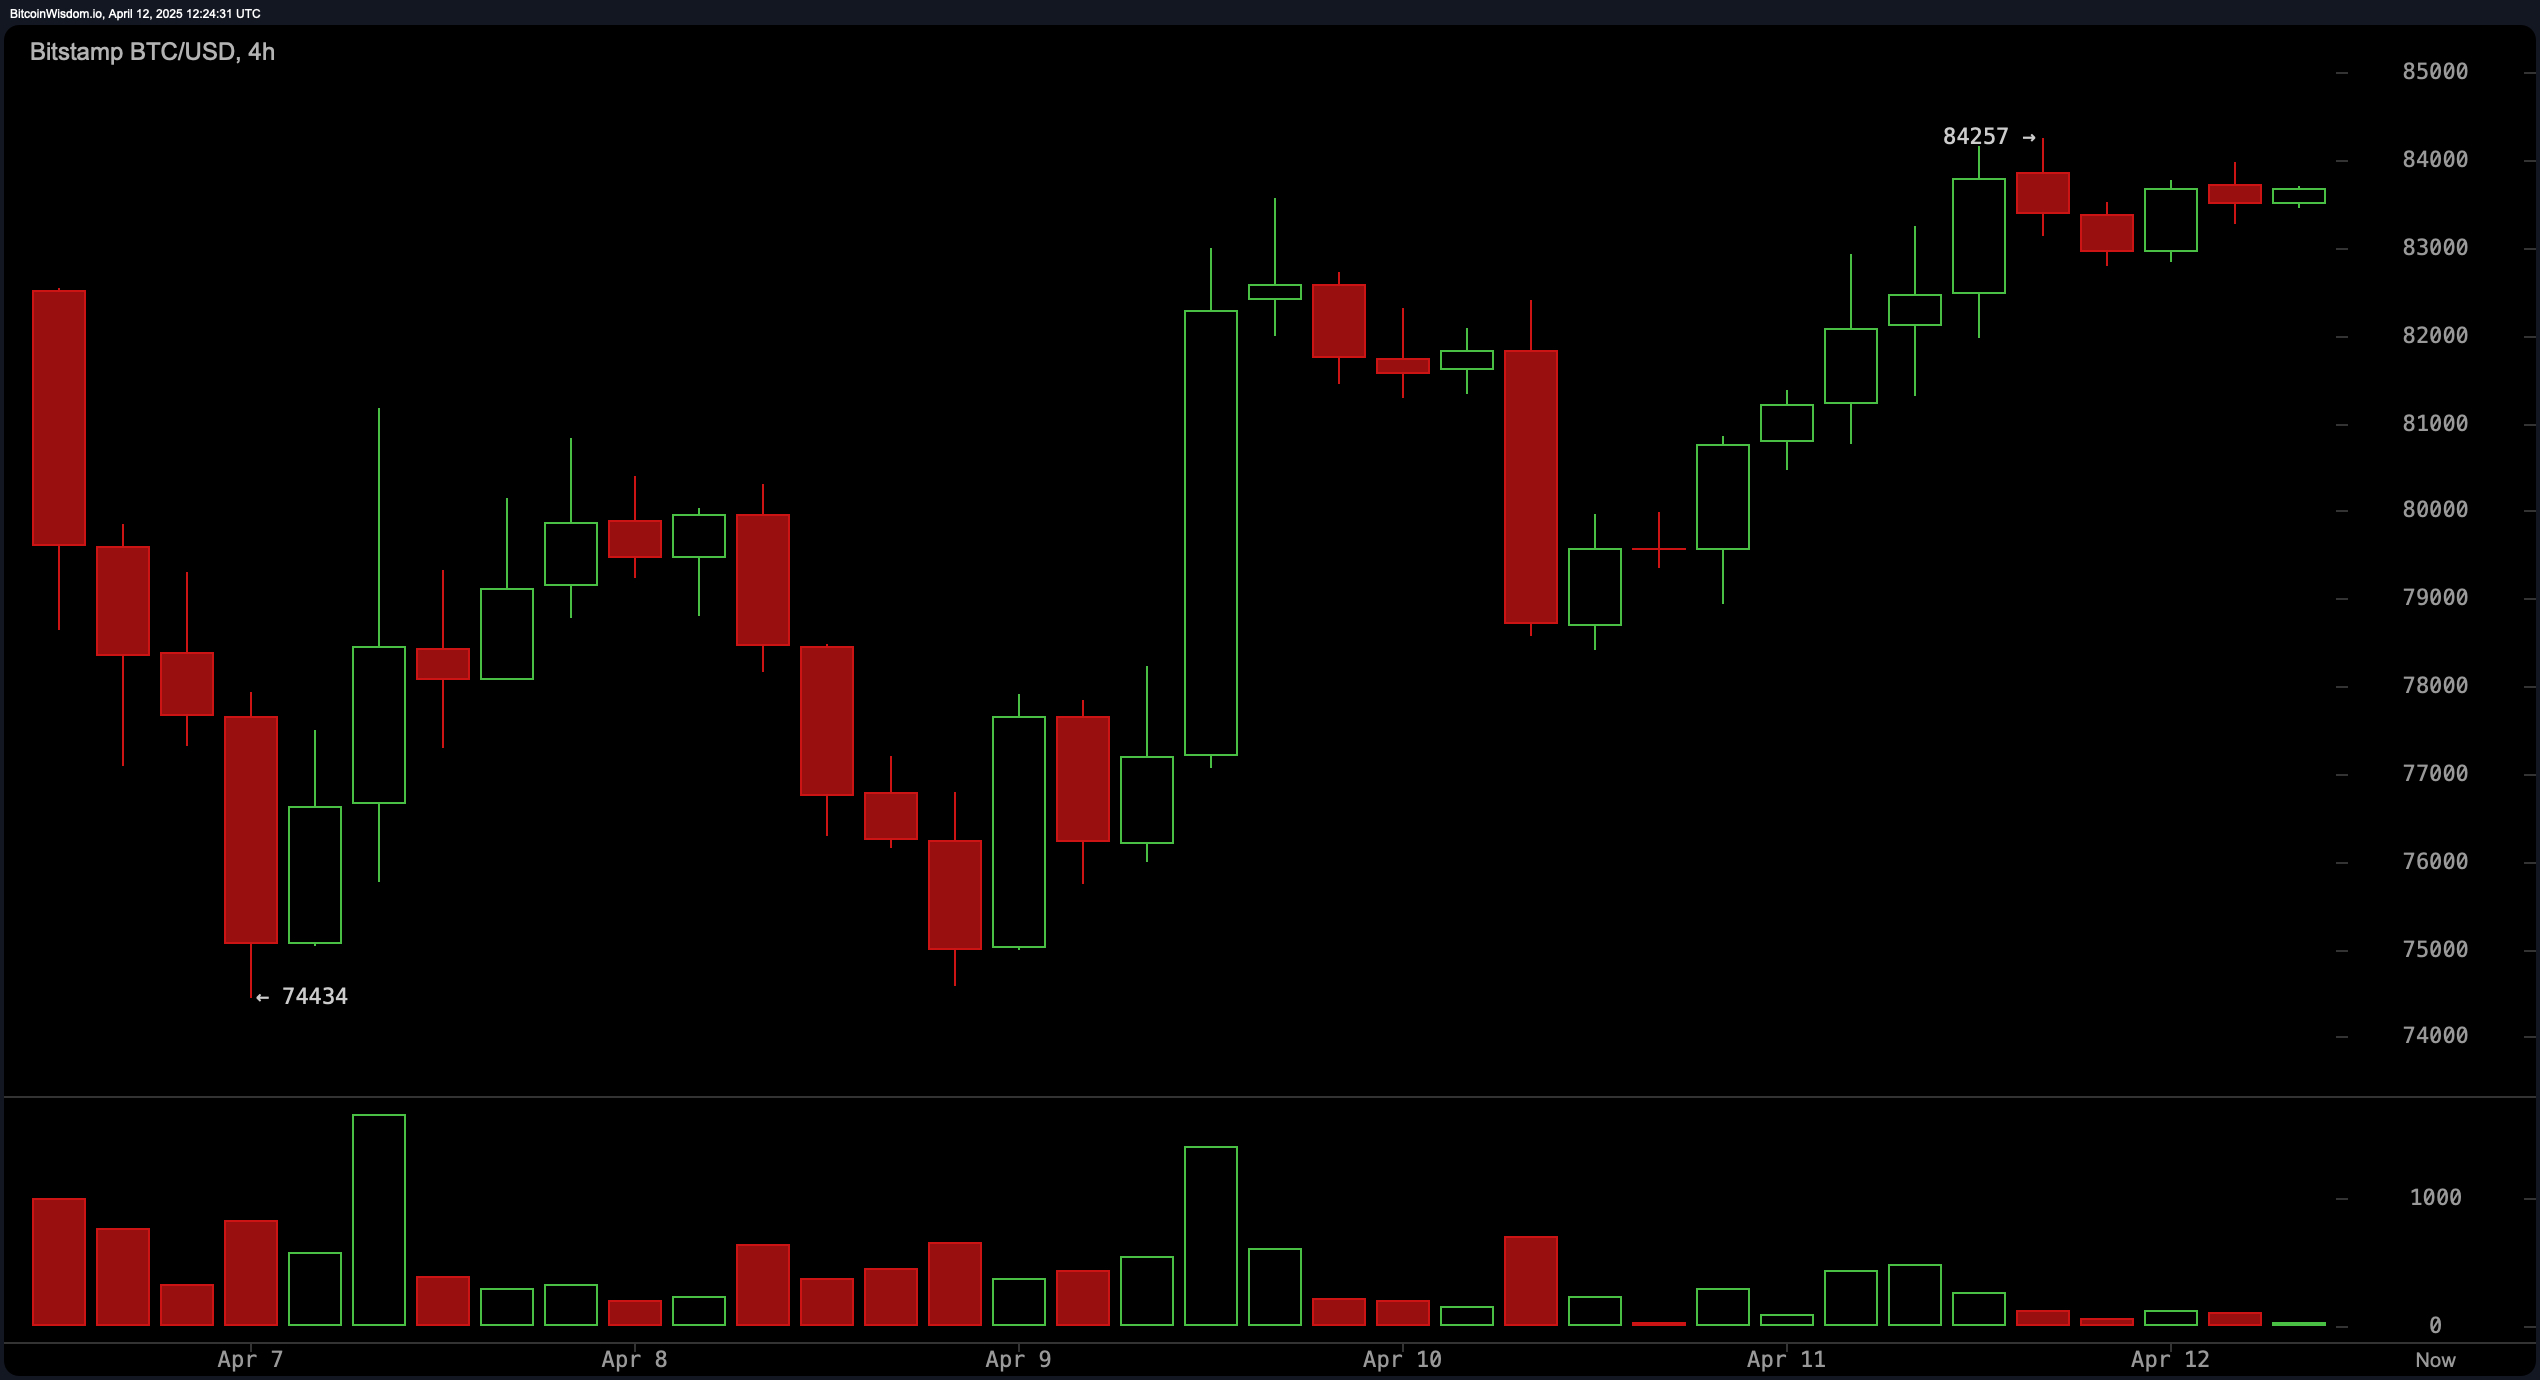
BTC/USD 4H chart via Bitstamp on April 12, 2025.
The daily timeframe provides a broader perspective of bitcoin’s evolving trend. Following a pronounced decline, the asset has shown signs of stabilization and recovery, evidenced by a shift toward higher closes and the invalidation of the short-term downtrend. Strong support is observed between $74,500 and $76,000, while the overhead resistance zone between $84,000 and $88,000 presents a formidable challenge. The macro view suggests cautious optimism, with the path of least resistance leaning upward unless the price drops decisively below the $74,000 level.
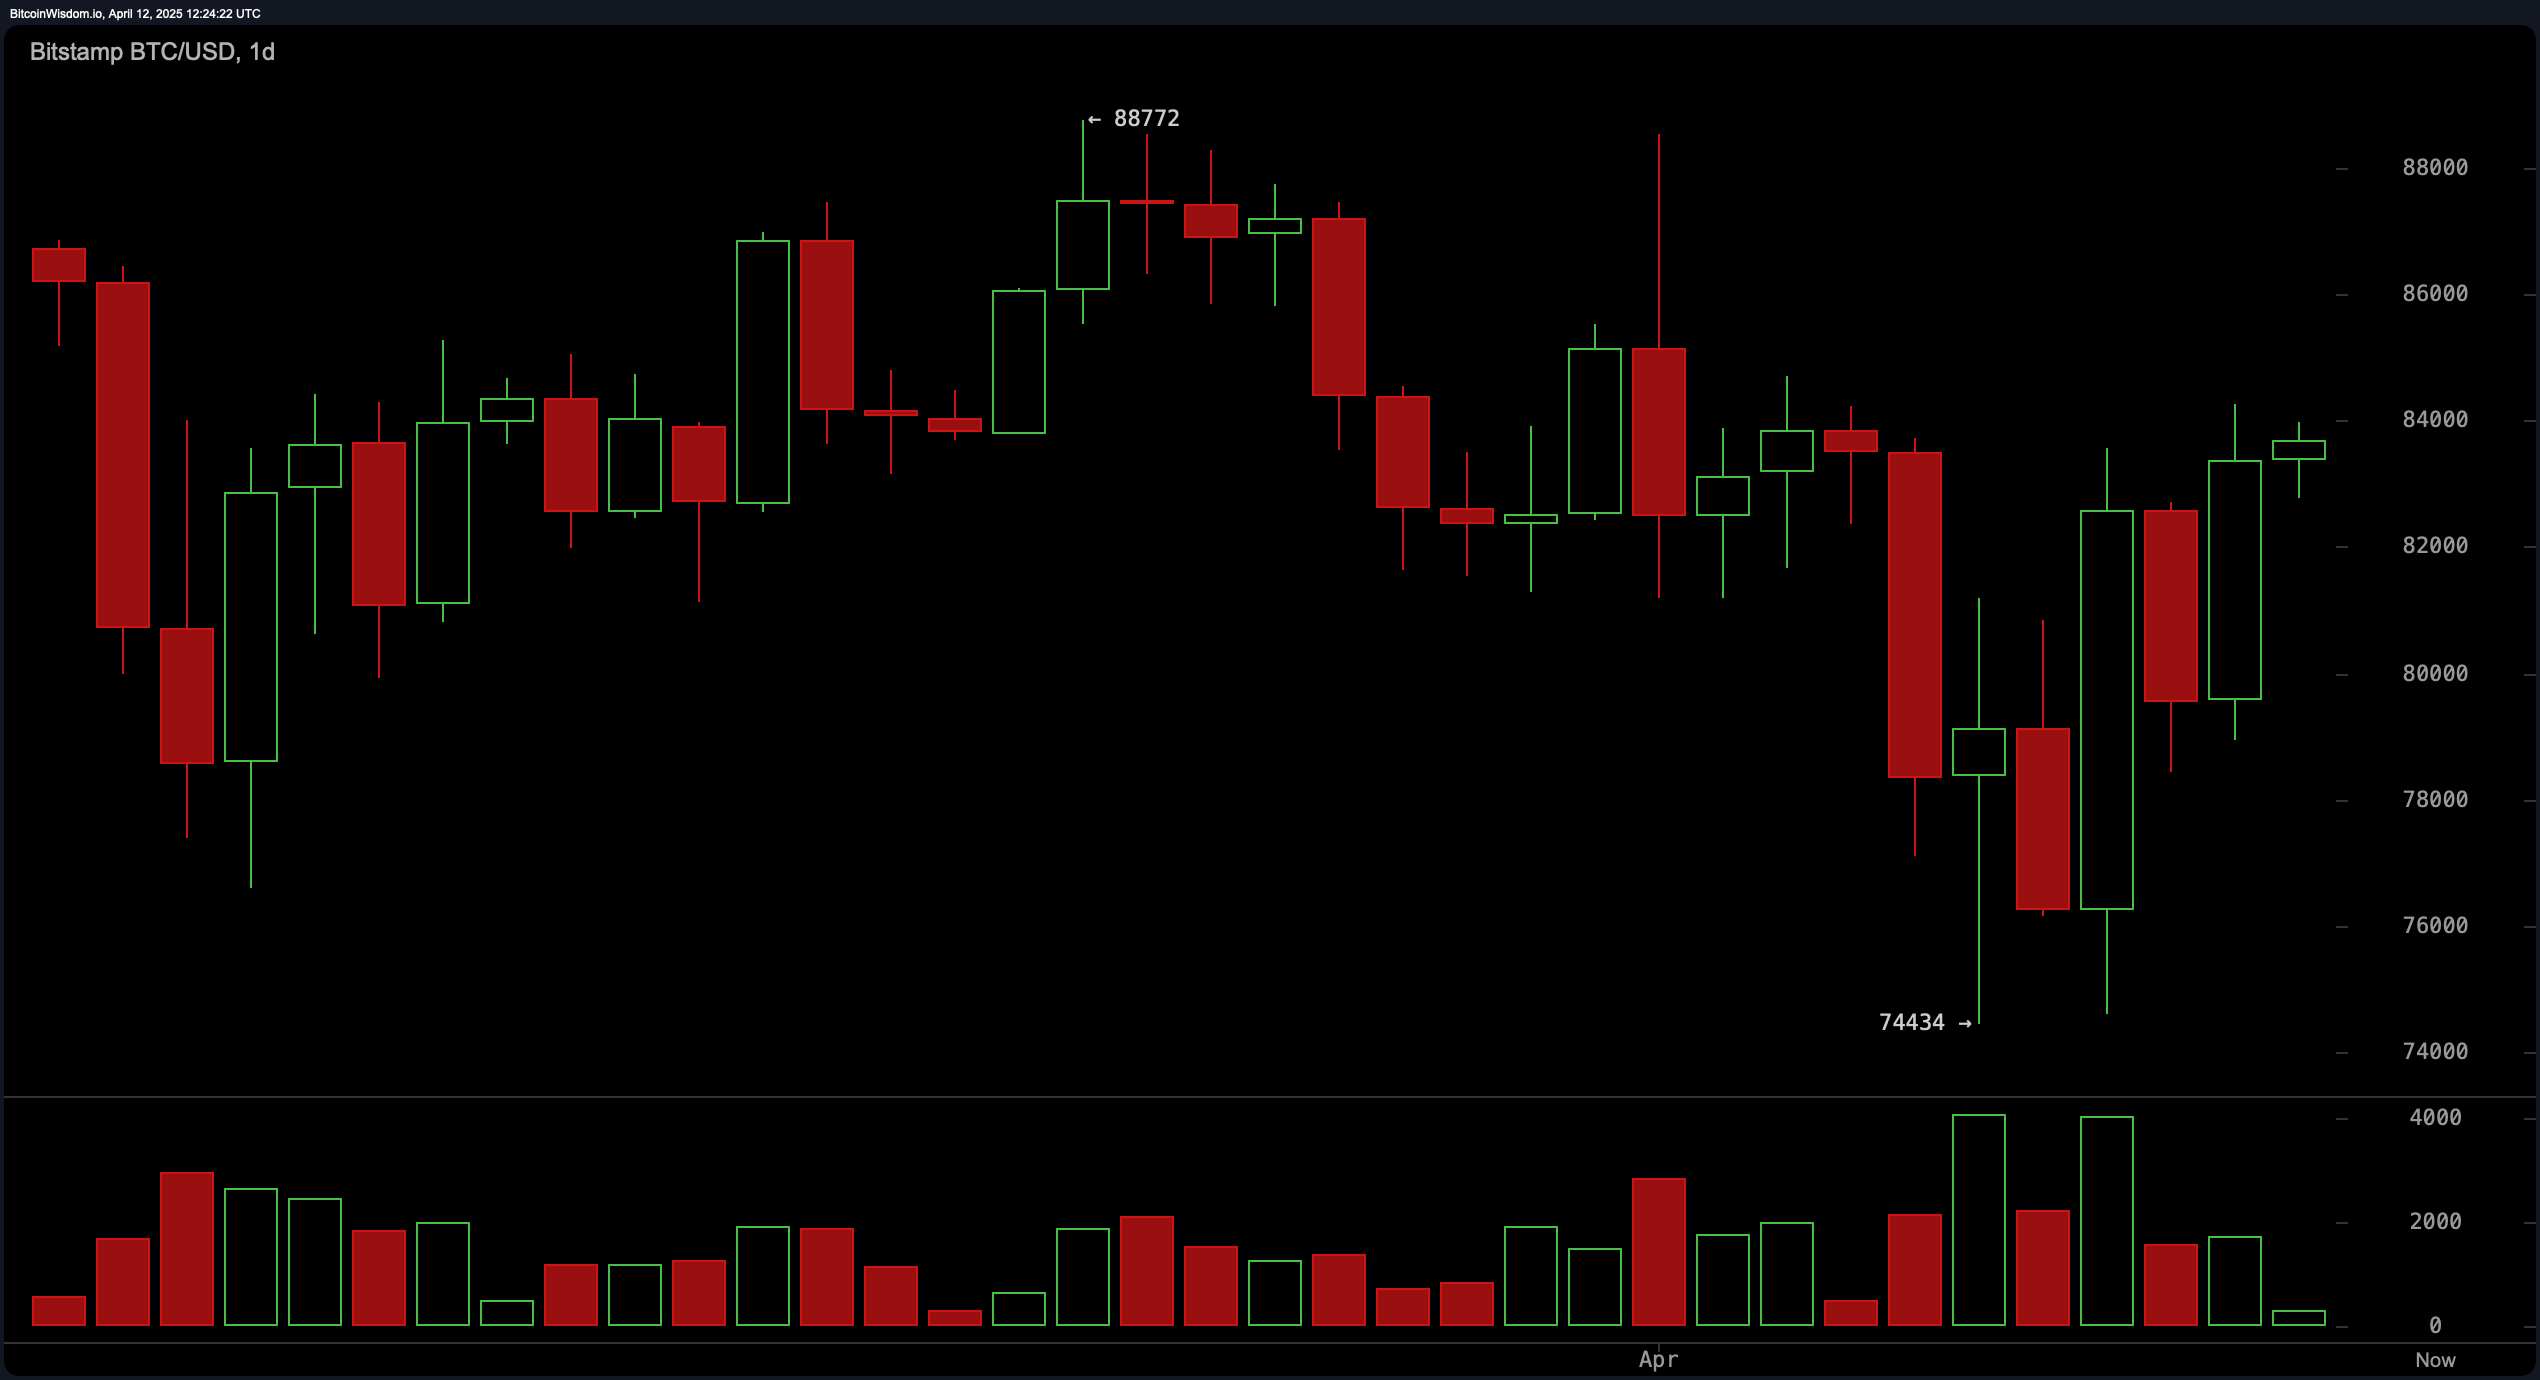
BTC/USD 1D chart via Bitstamp on April 12, 2025.
From a technical indicator standpoint, oscillators remain largely neutral, with the relative strength index (RSI), Stochastic oscillator, commodity channel index (CCI), average directional index (ADX), and awesome oscillator all signaling non-committal bias. However, momentum and the moving average convergence divergence (MACD) are both in buy territory, offering moderate support to bullish interpretations. These mixed signals underscore the need for confirmation through price action and volume before initiating directional trades.
In terms of moving averages, bitcoin is trading above its short-term trends. The exponential moving average (EMA) (10) and simple moving average (SMA) (10), as well as the EMA (20) and SMA (20), all indicate a buy signal. Mid-range indicators such as the EMA (30) and SMA (30) also support the upward bias. However, longer-term signals—EMA (50), SMA (50), EMA (100), SMA (100), EMA (200), and SMA (200)—reflect a bearish inclination, which could weigh on sustained momentum unless shorter-term trends pull the averages higher. This divergence between timeframes calls for a nuanced, time-sensitive trading approach.
Bull Verdict:
If bitcoin maintains its position above $83,000 and decisively breaks through the $84,200–$84,500 resistance zone, supported by bullish momentum indicators and buy signals from short-term moving averages, a continuation toward the $87,000–$88,000 range appears likely. Sustained accumulation and higher lows on the 4-hour chart reinforce a bullish trajectory, contingent on volume support and broader market sentiment.
Bear Verdict:
A failure to hold above $83,000—particularly if volume increases on a breakdown—may trigger a retracement toward the $80,000–$81,000 zone, with deeper correction risk down to the $78,000 or even $74,000 level. Longer-term moving averages reflecting bearish signals and neutral oscillators suggest that without renewed bullish volume, downside pressure could reassert itself swiftly.


Leave a Reply