
Recent on-chain data shows whales may be dumping Pepe ($PEPE) coin, depicting a swap of over half a billion dollars.
A whale paid 723.67 billion $PEPE in return for 4.63 million $DAI. Though this sale has increased the community, the token’s price hasn’t moved much, gaining about 12.63% in the last 24 hours as it trades at $0.000006728 as of press time.
However, there is a risk that this could trigger more sell-offs, which could see a price decline.
Will Pepe Coin’s Price Fall?
Large token holders affect the price by buying or selling a significant asset.
A significant sell-off is a bearish indicator as it represents the large holders trying to make a profit and avoid the potential market risk.
Despite this, the market is resilient, absorbing a large scale without derailing. This could be a precursor to a rebound.
However, it could also be a temporary blip before more sellers are put into play.
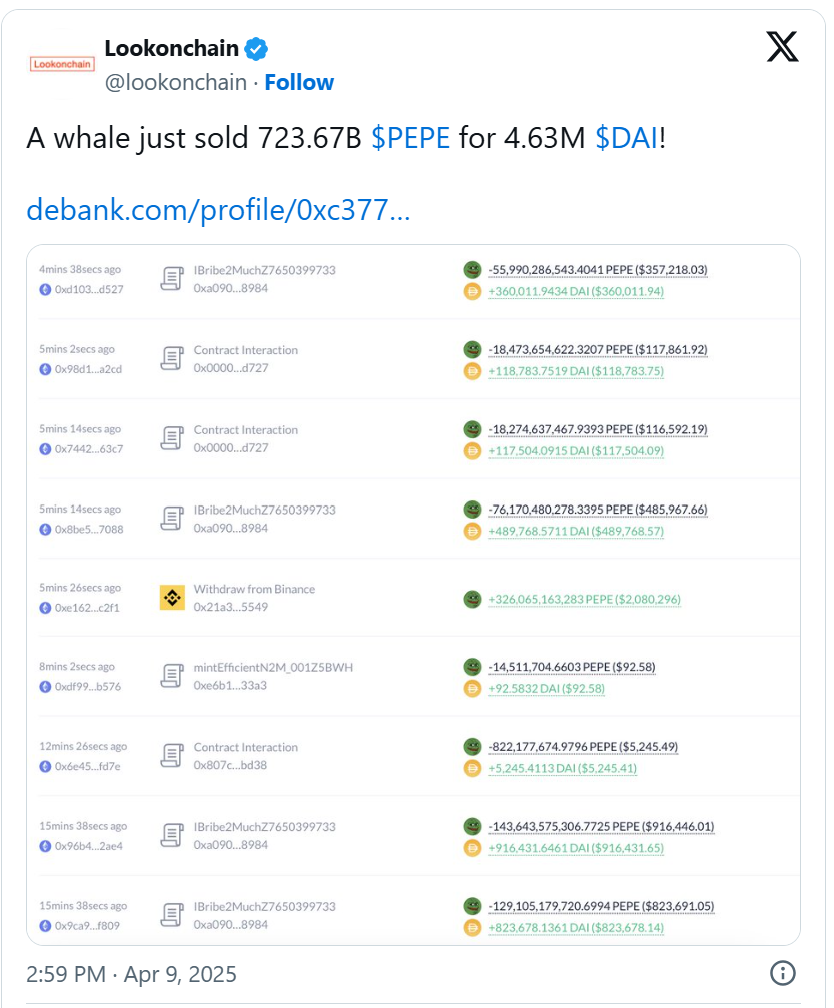
Source: @lookonchain | X
Based on recent market behavior, Pepe coin’s price chart seems to have a somewhat optimistic recovery.
The token started the potential rebound route after a substantial drop in early April.
Looking at the price chart, the price has generally been rising over the last few hours.
This indicates that buyers might begin to reenter to support the price after the selling period.
This could boost the market’s current price recovery from the significant dip witnessed at the start of April.
The trading volume over the last 24 hours is around $918.17 Million, down 12.23% from the day before.
This shows that the trading volume is down. It could be related to the market absorbing the whale sale or other macroeconomic factors affecting investor sentiment.
Pepe Trapped Inside Key Resistance and Support Zones
Charts show that Pepe has been roaming within a wide corridor. During this period, key resistance and support levels have been triggered.
Currently, the price is trying to rise above the resistance zone of approximately $0.00…669.
The price action also has been stuck between 50,100,200 Simple Moving Averages (SMA) and yellow and green SMAs.
The SMAs have converged toward the price, indicating the possibility of a bullish breakout in case of a price move above these key levels.
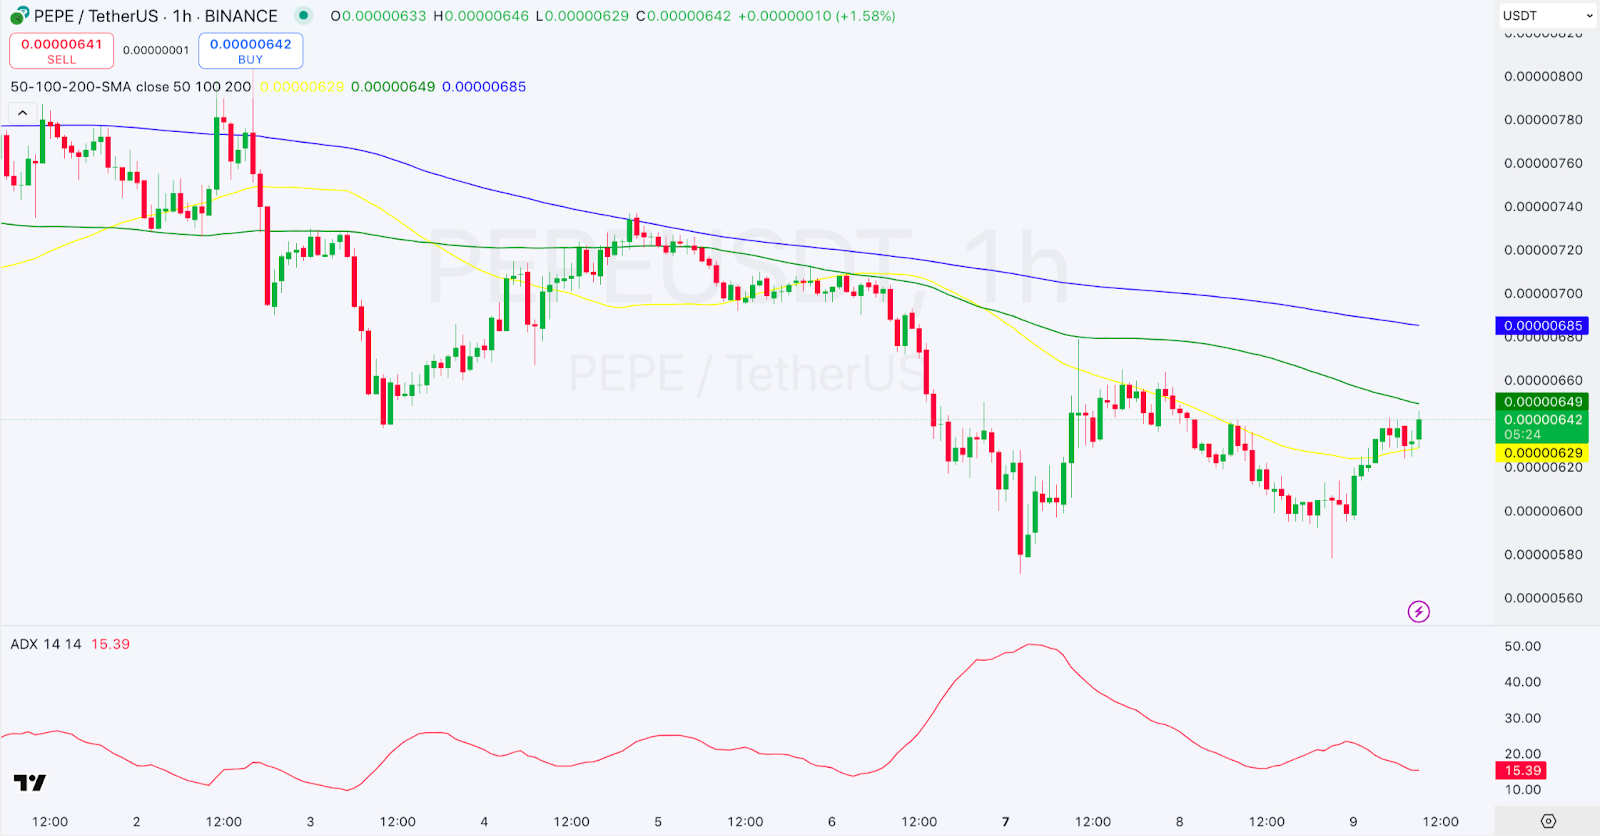
1-hour PEPE/USDT Chart | Source: TradingView
Furthermore, the Average Directional Index (ADX) is at 15.39. This means the existing trend is not very strong.
The low ADX reading indicates a weak trend, and until this is changed, higher can not be forced to predict any sustained move in any direction.
As seen in the 4-hour chart, it is evident that Pepe has been in a downward channel for some months.
Nevertheless, the most recent price action is close to a breakout. As long as the price continues to rise to break through the channel’s upper boundary, there may be an opportunity to move upward toward the $0.0000065 level.
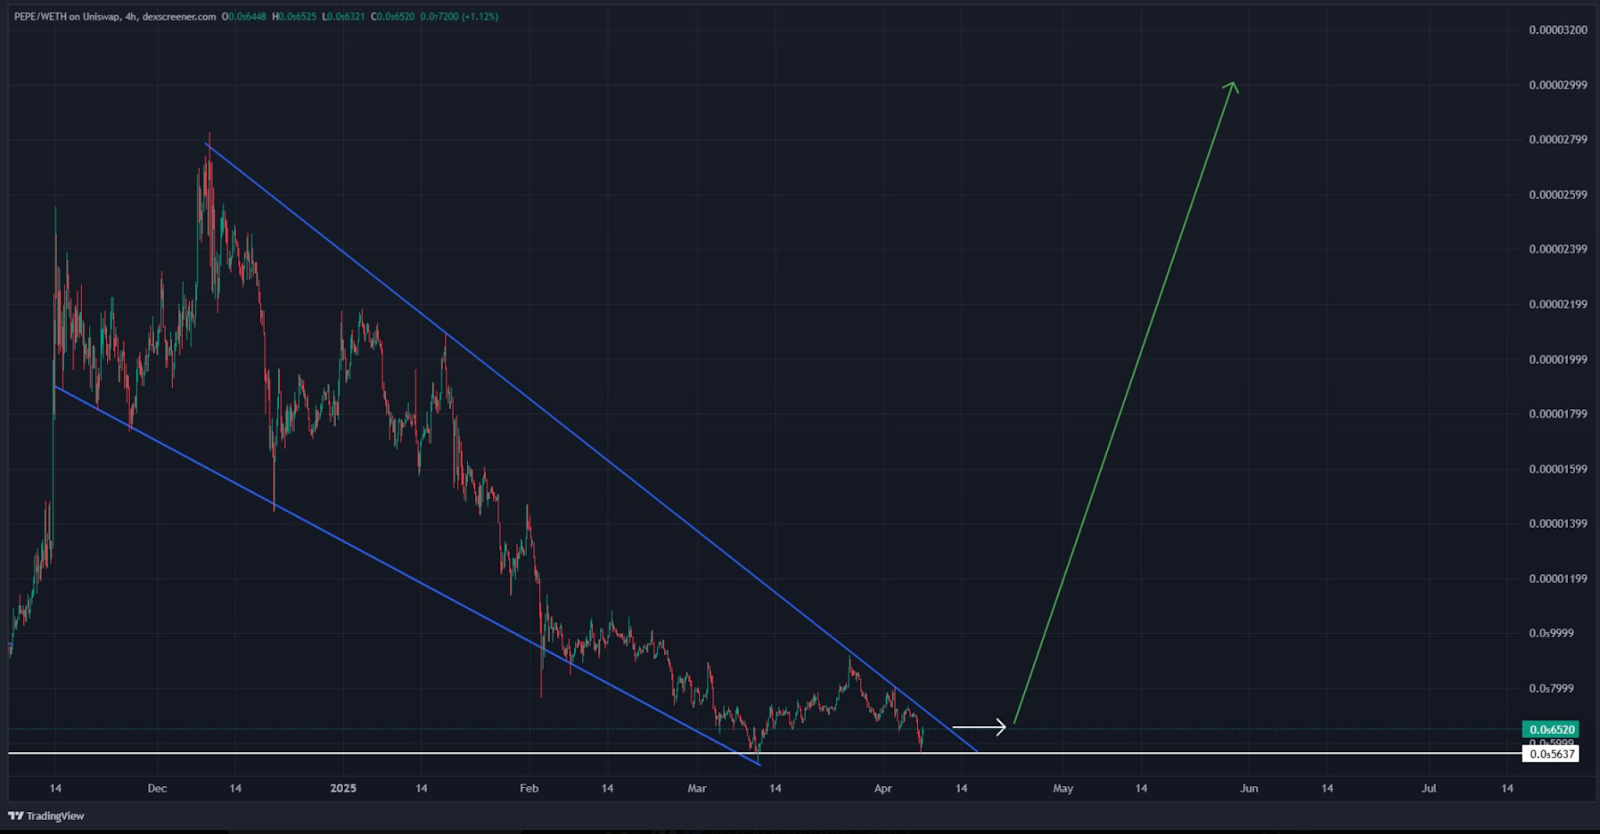
4-hour PEPE/WETH Chart | Source: TradingView
As we look ahead, Pepe coin’s price stability is mainly dependent on the behavior of big holders and market sentiment.
The whale’s decision to sell many holdings might have made investors nervous.
However, the price’s recovery and sideways action could suggest a more stable phase.
At the time of writing, Pepe’s total market capitalization is $2.81 billion, up 5.89% from the previous day.