
Data shows that bitcoin has held firm above the $100,000 threshold for 23 straight days—an unprecedented streak. Moreover, the network’s computing strength has hit its highest point this year, positioning 2025 as a standout period for several notable benchmarks. Although the bull cycle has delivered striking moves in both price and hashrate, metrics from onchain activity to off-chain indicators have trailed behind, exhibiting clear signs of decline.
New Highs for Bitcoin, But Core Metrics Slip Back
Bitcoin shattered multiple records last year, and 2025 has proven no different. On May 22, 2025, the leading digital asset reached a peak of $112,000 on Bitstamp, while aggregated data from Coingecko and Coin Market Cap places the weighted high between $111,814 and $111,970 across a broad array of trading platforms. Glassnode data indicates that May 22 marks the third all-time high (ATH) within the current cycle.
One standout metric this year shattering historical records is bitcoin’s hashrate. On May 8, 2025, the network’s total computational horsepower climbed to an unprecedented 929 exahash per second (EH/s). This new peak comes despite mining difficulty reaching punishing levels and a sharp revenue compression that’s lingered since the April 20, 2024 halving event. At present, miners are earning roughly 22% less per petahash compared to the median payout prior to the fourth halving.
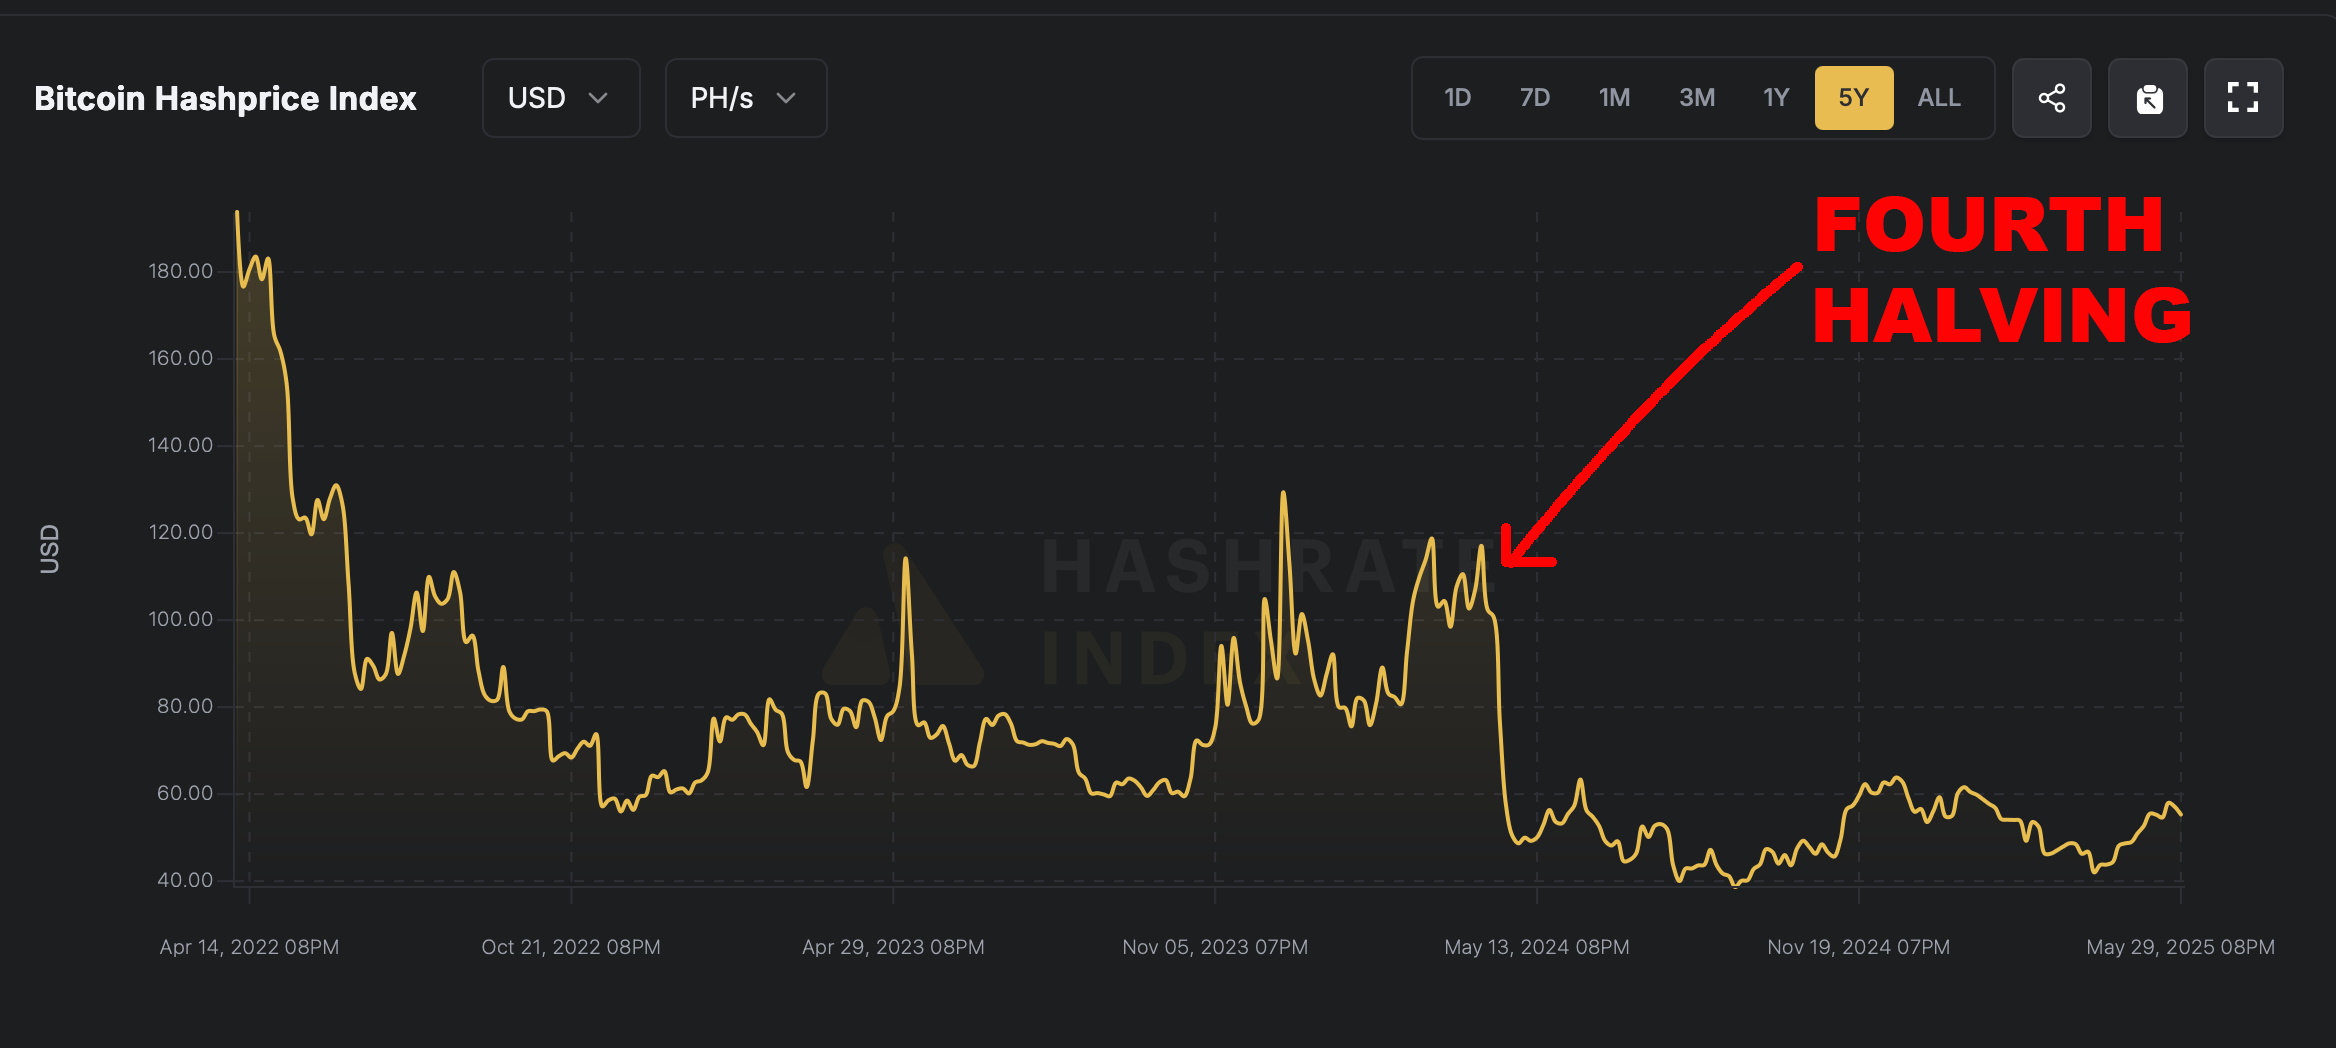
Bitcoin’s hashprice or the estimated value of 1 petahash per second every day according to hashrateindex.com.
Before the halving, median earnings stood near or around $75 per petahash per second (PH/s), implying that bitcoin ( BTC) would need to surpass $139,300 per BTC for the hashprice to revert to earlier profitability levels. This estimate excludes transaction fees, which in 2025 have dwindled to roughly 1% of daily miner revenue. Fee volume has cratered from 2024 levels, making bitcoin’s spot price the primary variable in miner profitability calculations.
On- and Off-Chain Engagement Shrinks
A further downturn is visible in onchain engagement—namely, block space utilization. Transaction throughput per day has collapsed this year, and the mempool, once overwhelmed with over 700,000 pending transfers, has been entirely cleared. The resulting fee drought has left miners navigating a lean environment. At specific intervals, such as blocks 899008 through 899056, numerous blocks appear only half or even one-quarter full.
Bitcoin transactions per day chart since February 2023 via Blockchair.
Daily transactions have fluctuated between 290,000 at the low end and 630,000 at the high, settling at a median of roughly 460,000 transfers per day in 2025. Off-chain metrics also signal contraction, particularly within the Lightning Network. Channel counts have halved, plunging from over 80,000 in September 2022 to just above 40,000 today. Simultaneously, network capacity—the aggregate BTC locked in channels—has declined as well.
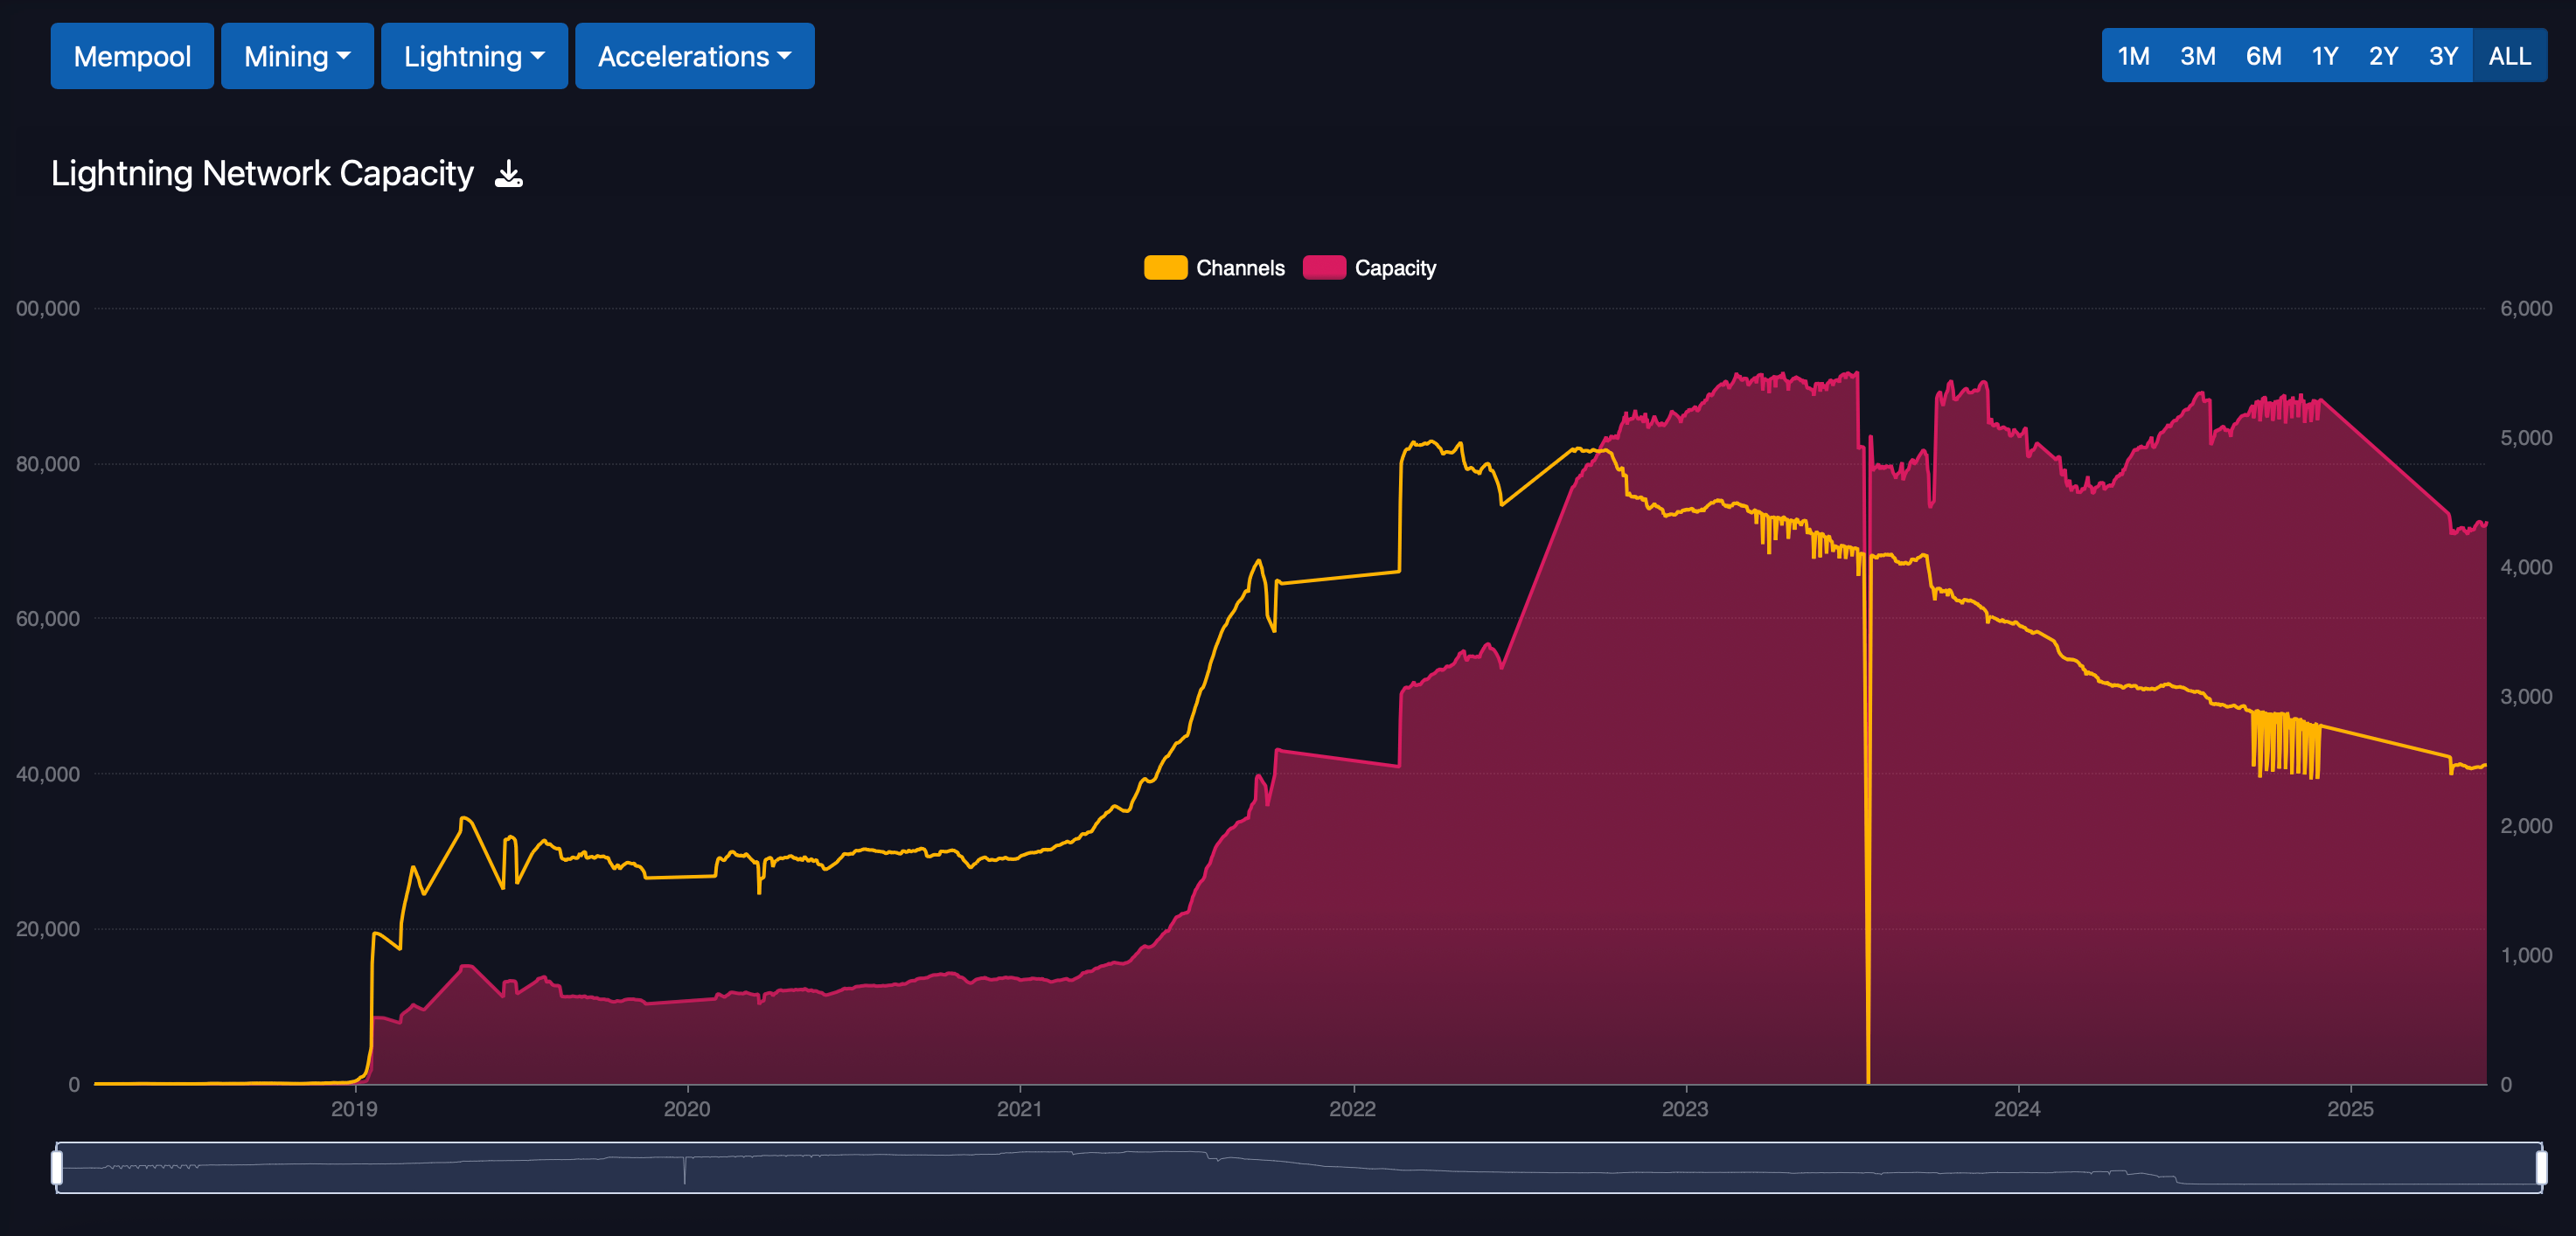
Lightning capacity and channels via mempool.space.
Since November 2024, Lightning Network capacity has slid from more than 5,000 BTC to just above 4,300 BTC, marking the lowest threshold since 2022. Additionally, the network has not managed to sustain any consistent growth beyond the 5,000 BTC level since October 2022. With structural adjustments underway both on- and off-chain, the market may be entering a period where operational efficiency outweighs raw scale.
Whether this current recalibration sets the stage for resurgence or signals longer-term constraint remains an open question for the network’s evolving economics.


Leave a Reply