
- Bitcoin closes below the critical $106,400 support level, signaling the potential for a deeper correction.
- Ethereum struggles to breach the $2,724 resistance, with weakening momentum increasing downside risk.
- Ripple dips under its 50-day EMA, setting the stage for a possible pullback toward $1.96.
Bitcoin (BTC) trades below $106,000 on Friday after slipping below a crucial support level, increasing the likelihood of a deeper correction. Ethereum (ETH) faces rejection from a key level while Ripple (XRP) closes below its important support zone, both suggesting increasing downside risks in the near term.
Bitcoin closes below key support, heading toward the $100,000 mark
Bitcoin price dipped and closed below its daily level of $106,406 on Thursday, following its ongoing correction over the previous two days. At the time of writing on Friday, it hovers and trades at around $105,600.
If BTC continues its correction, it could extend the decline to revisit its psychologically important level of $100,000.
The Relative Strength Index (RSI) reads 54, pointing downward toward its neutral level of 50, indicating fading bullish momentum. Additionally, the Moving Average Convergence Divergence (MACD) indicator also showed a bearish crossover. It also shows rising red histogram bars below its neutral level, indicating a correction ahead.

BTC/USDT daily chart
However, if BTC recovers and closes above its all-time high, it could extend the rally toward the key psychological level of $120,000.
Ethereum shows weakness as it faces rejection from its $2,724 resistance
Ethereum price faced rejection around its daily level of $2,724 on Thursday and declined slightly. At the time of writing on Friday, it continues to trade down around $2,600.
Suppose ETH continues its correction and closes below the 200-day Exponential Moving Average (EMA) at $2,455 on a daily basis. ETH could extend the decline to retest its next support level at $2,277, its 50-day EMA.
The RSI on the daily chart reads 64, having been rejected from its overbought level of 70 on Wednesday, and is pointing downward, indicating a fading bullish momentum. The MACD indicator also displayed a bearish crossover, further underscoring the weakness in momentum and indicating a potential downward trend.
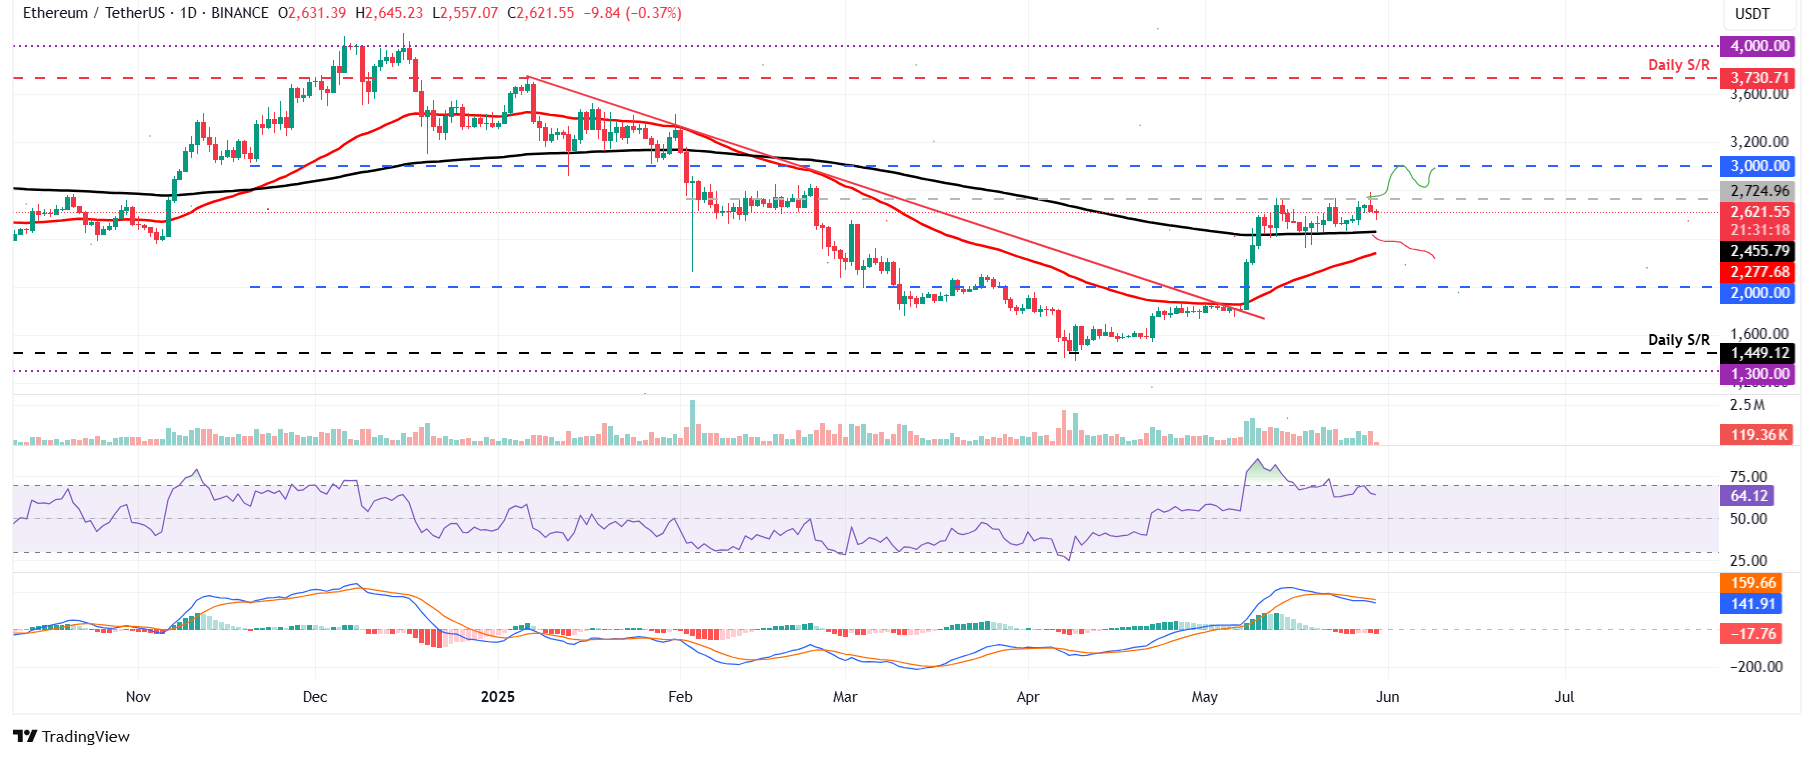
ETH/USDT daily chart
Conversely, if ETH breaks and closes above its $2,724 resistance on a daily basis, it could extend the rally to retest its psychologically important level at $3,000.
XRP faces a downleg as it closes below its 50-day EMA
XRP price faced a pullback and closed below its 50-day EMA at $2.29 on Wednesday, declining 3% the following day. At the time of writing on Friday, it continues to trade down around $2.21.
If XRP continues its downward trend, it could extend the correction to retest its next support level at $1.96.
The RSI on the daily chart reads 41, below its neutral level of 50 and points downward, indicating strong bearish momentum. The MACD indicator also displayed a bearish crossover, further underscoring the weakness in momentum and indicating the continuation of a downward trend.
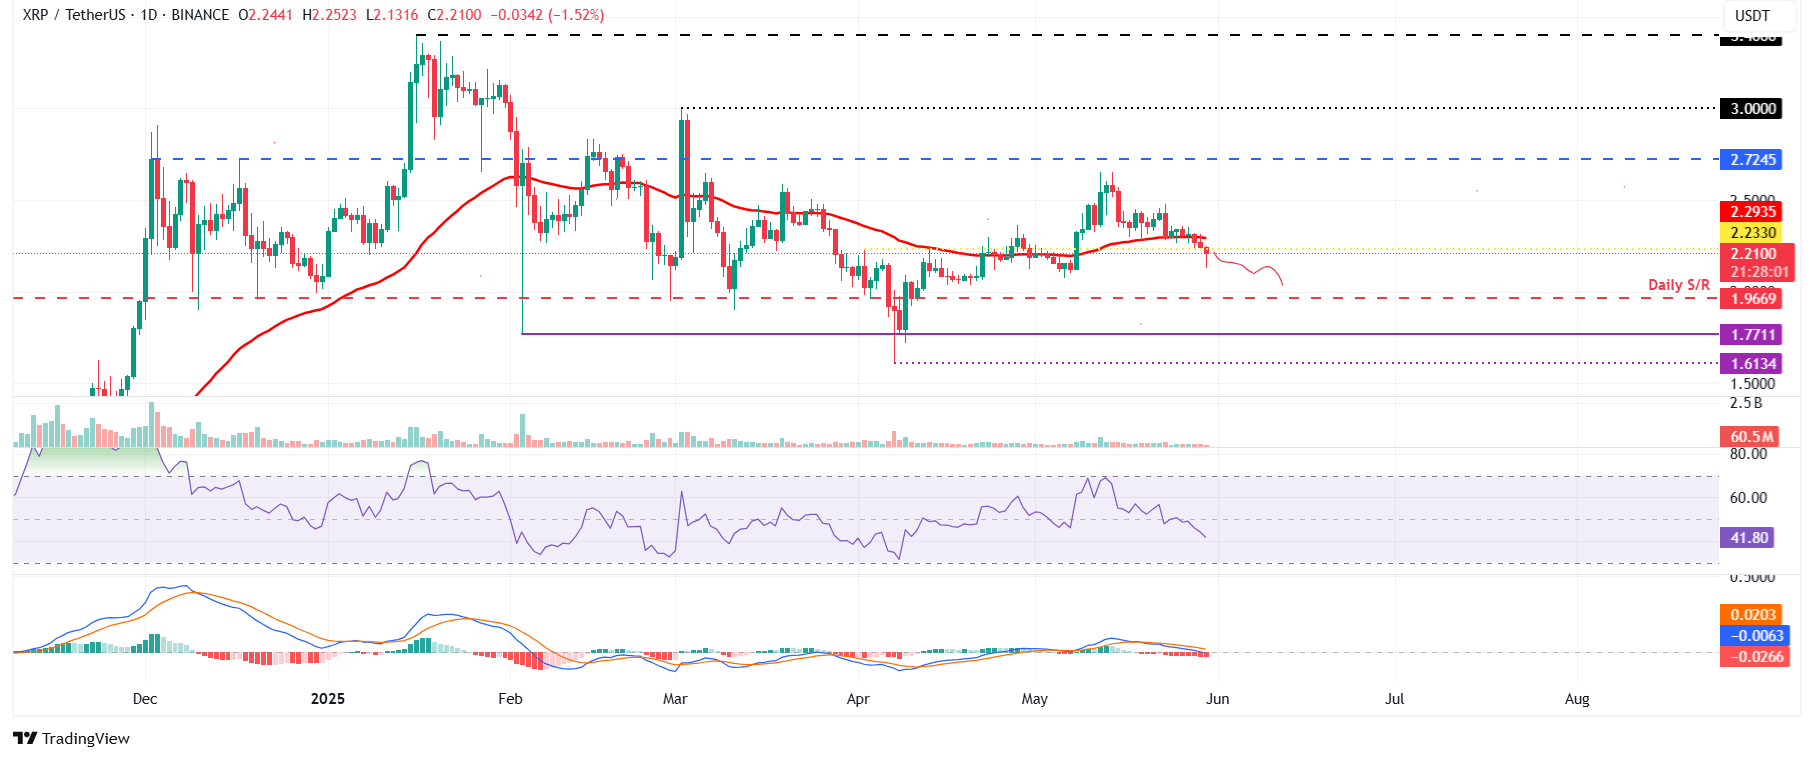
XRP/USDT daily chart
On the other hand, if XRP recovers, it could extend the recovery to retest its 50-day EMA at $2.29.


Leave a Reply