
After tagging a local top near $110,800 earlier this week, the Bitcoin price today is hovering near $108,750, reflecting mild intraday pressure. While the broader uptrend remains intact, the recent pullback has brought short-term caution into focus. With key indicators flashing mixed signals, traders are closely watching the $108K–$110K zone for clarity on Bitcoin’s next leg.
BTC price analysis (Source: TradingView)
The current Bitcoin price action comes after a strong upside breakout from the $95K–$100K range, where buyers established a solid base. But as price now trades beneath a short-term triangle resistance, momentum appears to be fading into consolidation. The question is, Why Bitcoin price going down today, and could this be the start of a broader pullback or just a healthy pause before continuation?
What’s Happening With Bitcoin’s Price?
BTC price analysis (Source: TradingView)
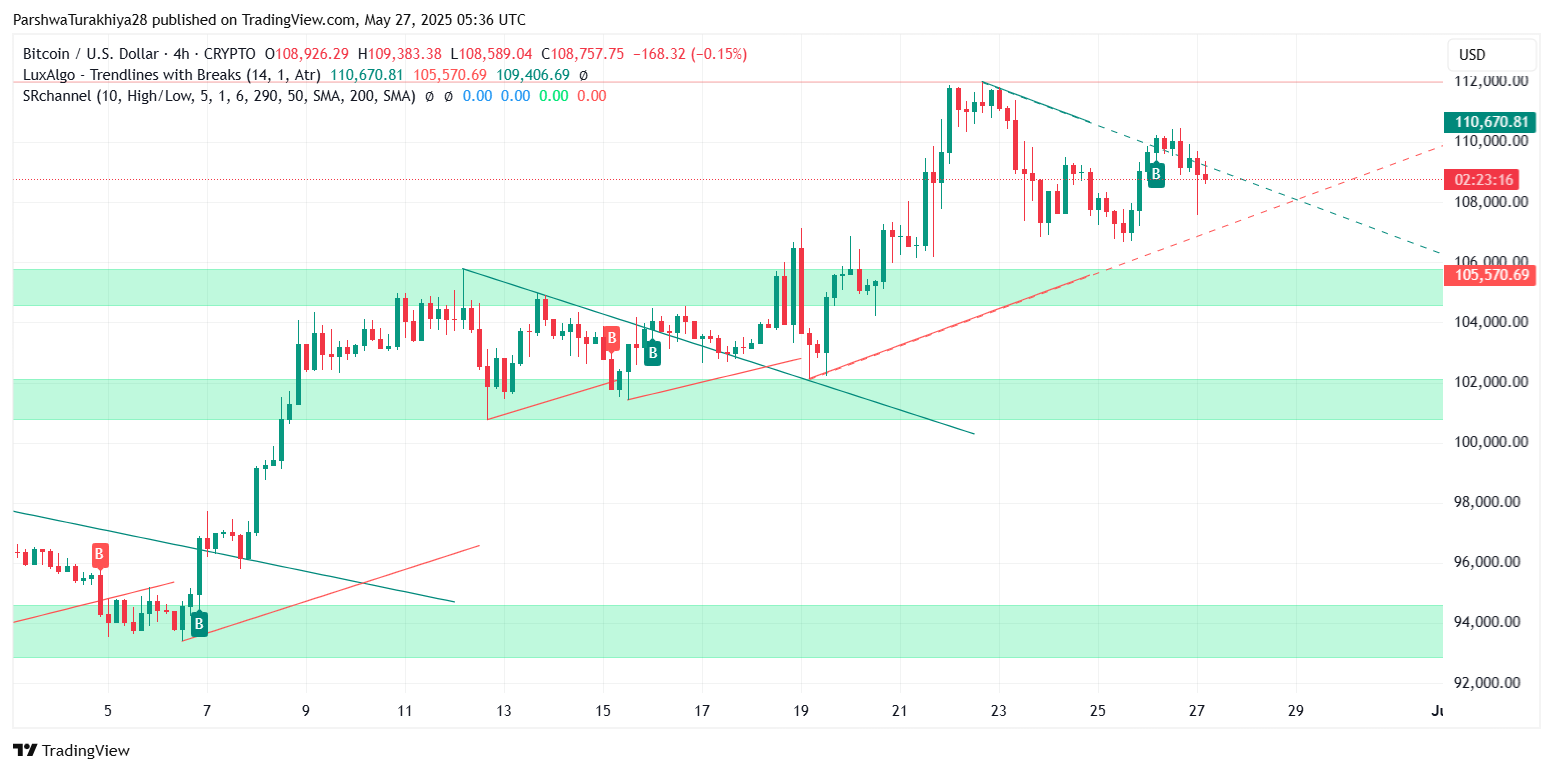
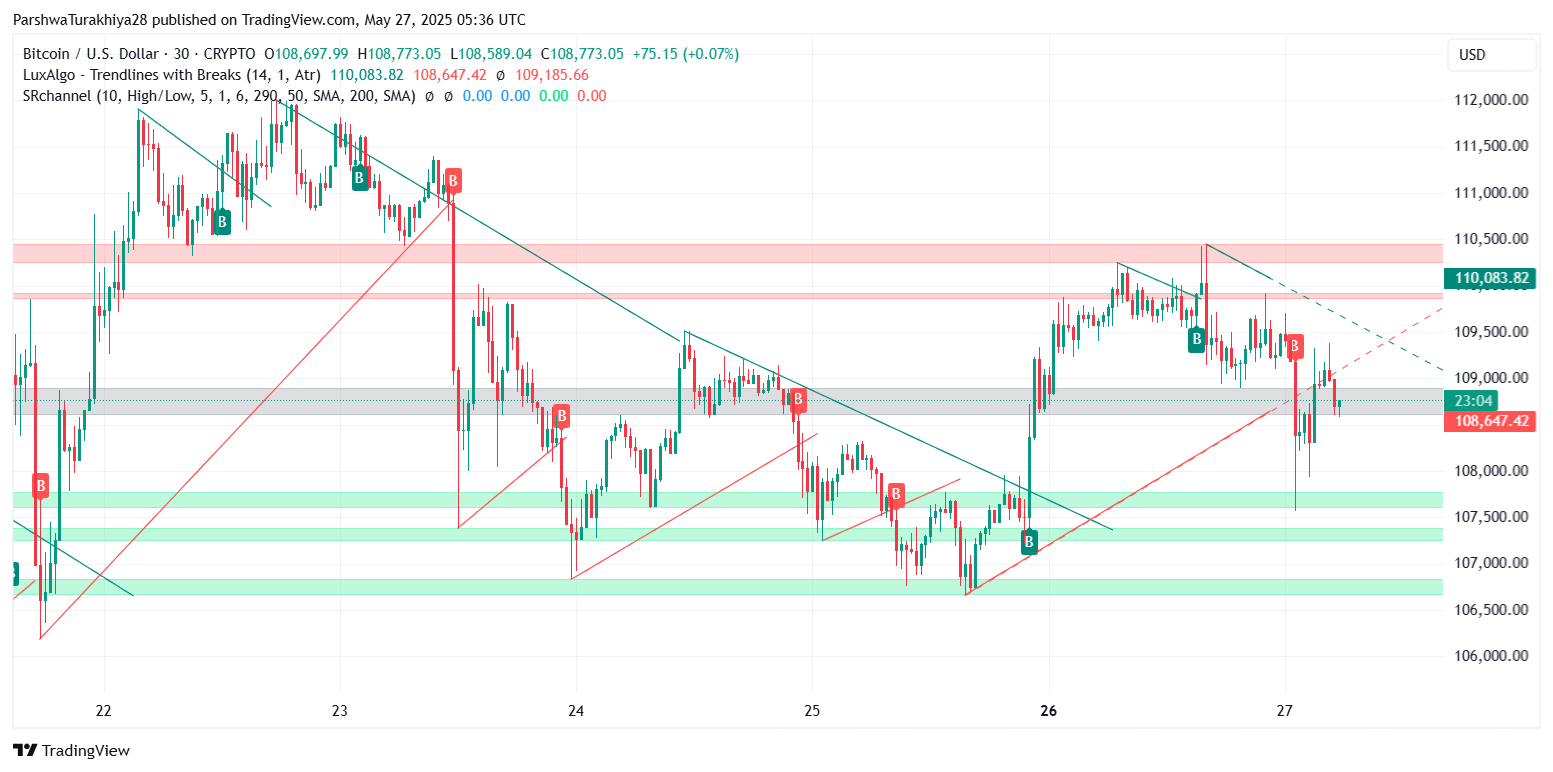
On the 4-hour chart, Bitcoin recently broke down from a rising wedge pattern and is now testing the lower boundary of a symmetrical triangle structure, with support near $108,000 and resistance capped around $110,600. This compression follows an aggressive rally from May 20, during which the Bitcoin price spiked nearly 12% in five days. However, the failure to hold above the wedge top and the subsequent rejection at $110.5K suggests near-term exhaustion.
BTC price analysis (Source: TradingView)
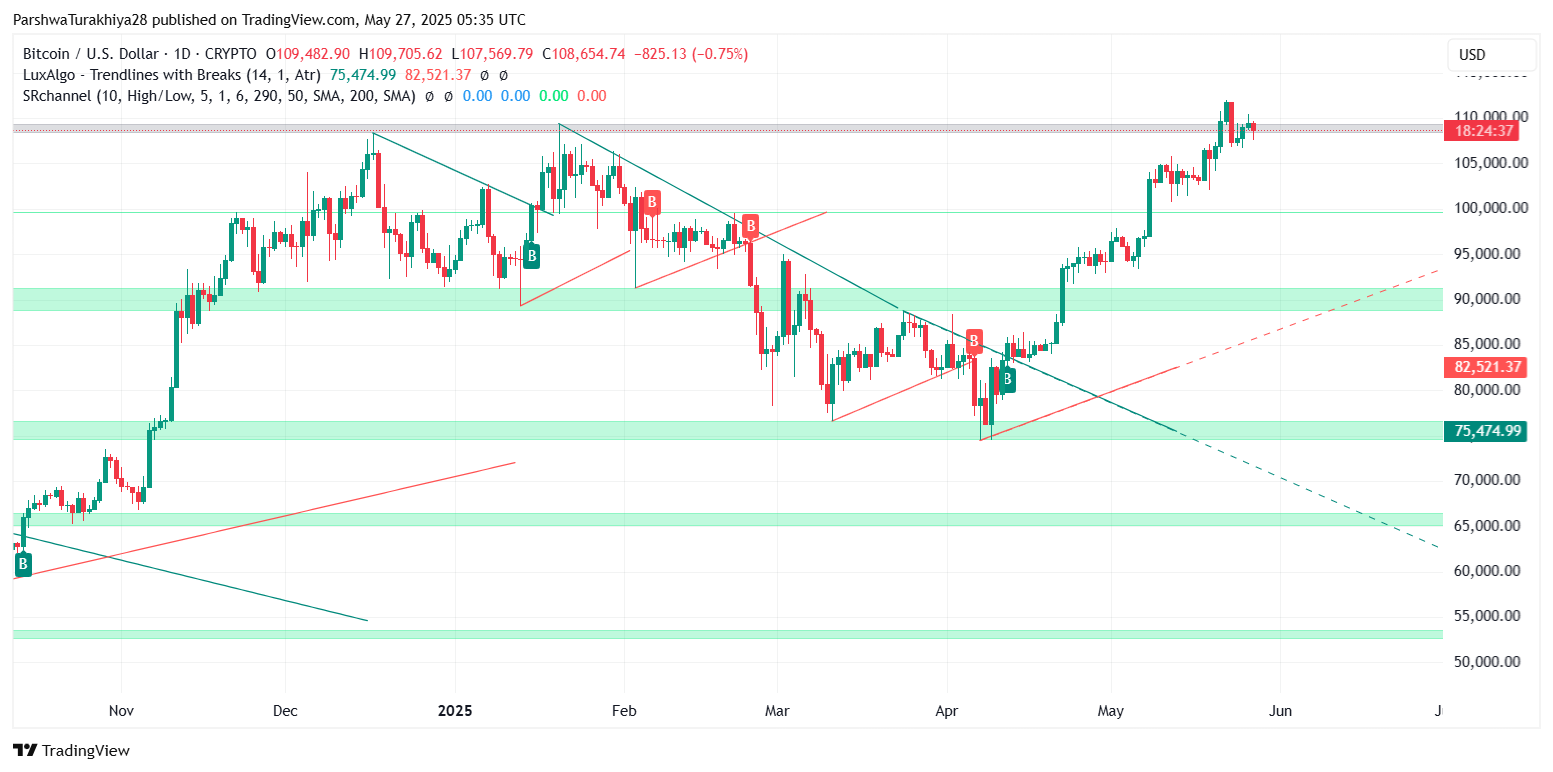
Meanwhile, the daily chart shows that Bitcoin is still trading above the ascending trendline formed in early April. The broader Bitcoin price update indicates a bullish structure overall, but losing $108K on high volume could confirm a short-term shift toward $105,500–$103,800 support. Price remains above all key EMAs, with the 20 and 50 EMA levels currently converging around $108,900 and $107,900 respectively, providing initial cushions.
RSI, MACD and Volatility Signal Reversal Risk
BTC price analysis (Source: TradingView)
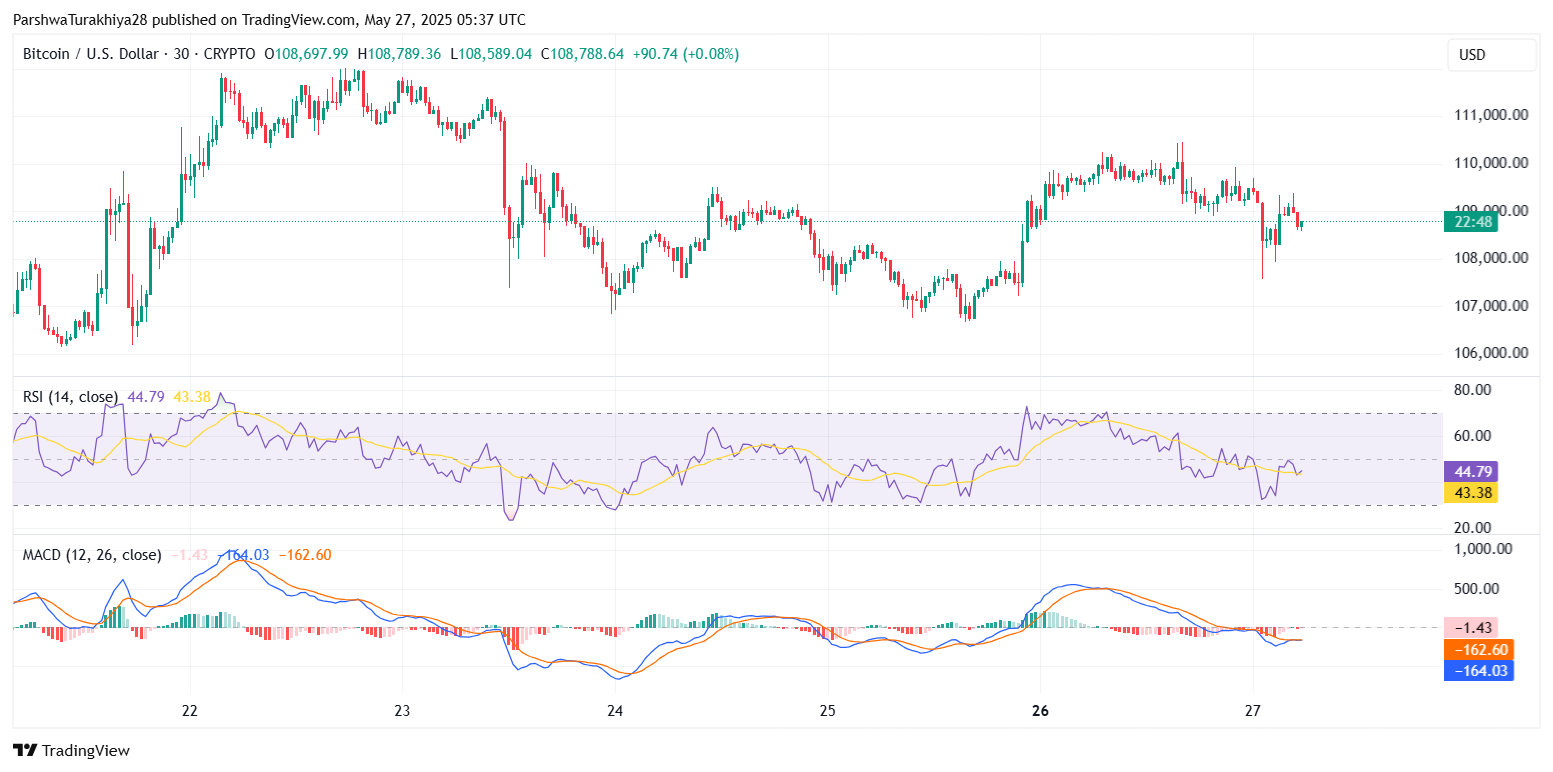
The Relative Strength Index (RSI) on the 30-minute chart is currently below 45, down from its overbought levels above 70 just days ago. This shows a steady decline in buying momentum. On the 4-hour RSI, readings have dropped back toward 43.3, suggesting a move into neutral-bearish territory.
Likewise, MACD on the 30-minute chart shows a weakening histogram and a bearish crossover forming below the signal line, which supports the current stalling narrative. The Bitcoin price volatility has also compressed on lower timeframes, with Bollinger Bands narrowing sharply—usually a prelude to a high-volume move.
BTC price analysis (Source: TradingView)
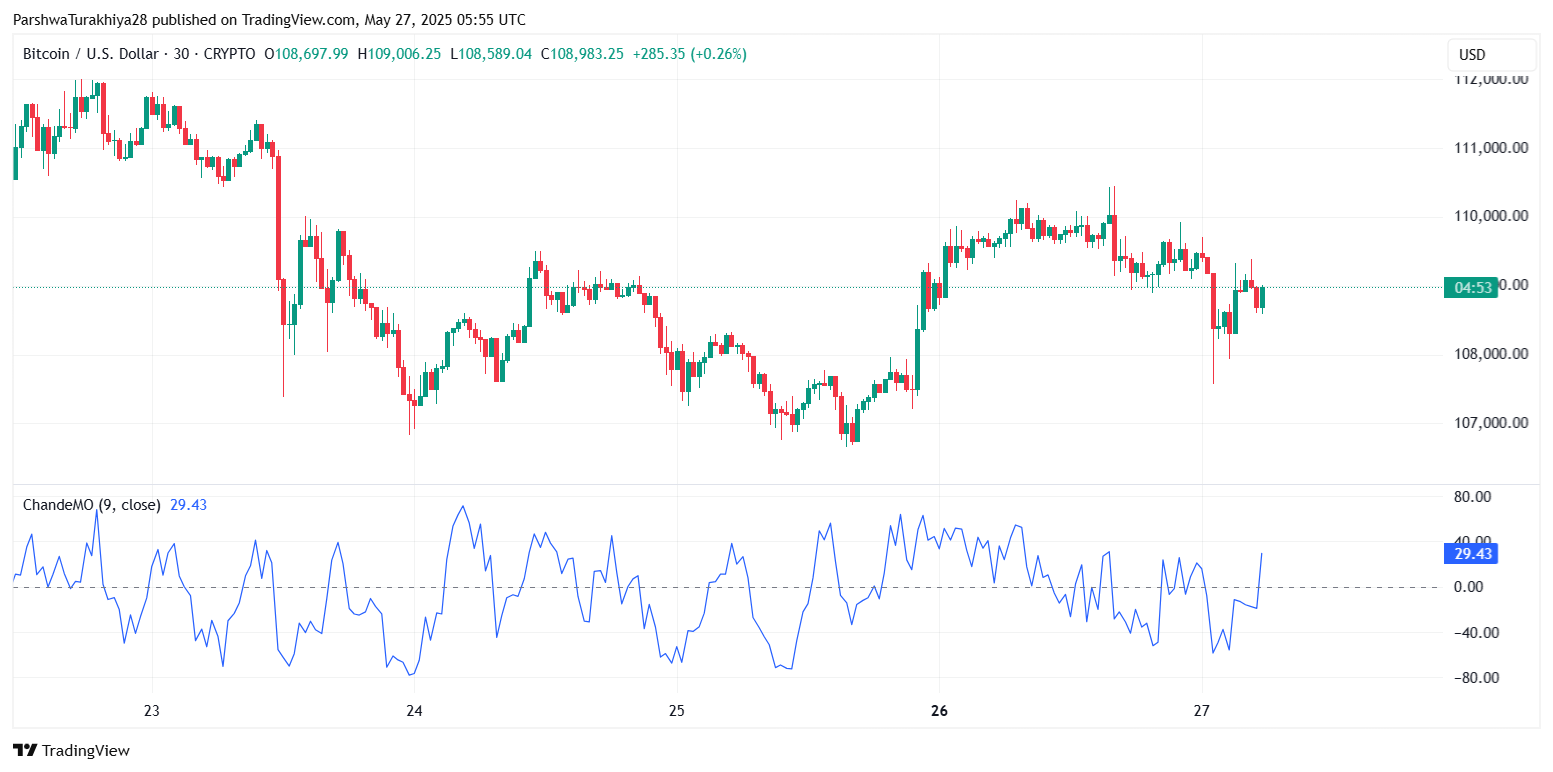
Stoch RSI is curling downward from the overbought region, while the Chande Momentum Oscillator (ChandeMO) reads around 29, indicating that short-term upside momentum is losing strength. Overall, momentum indicators are hinting at a possible local top and cooling phase unless bulls reclaim $110K with strength.
Ichimoku Cloud and Bollinger Band Structure
BTC price analysis (Source: TradingView)
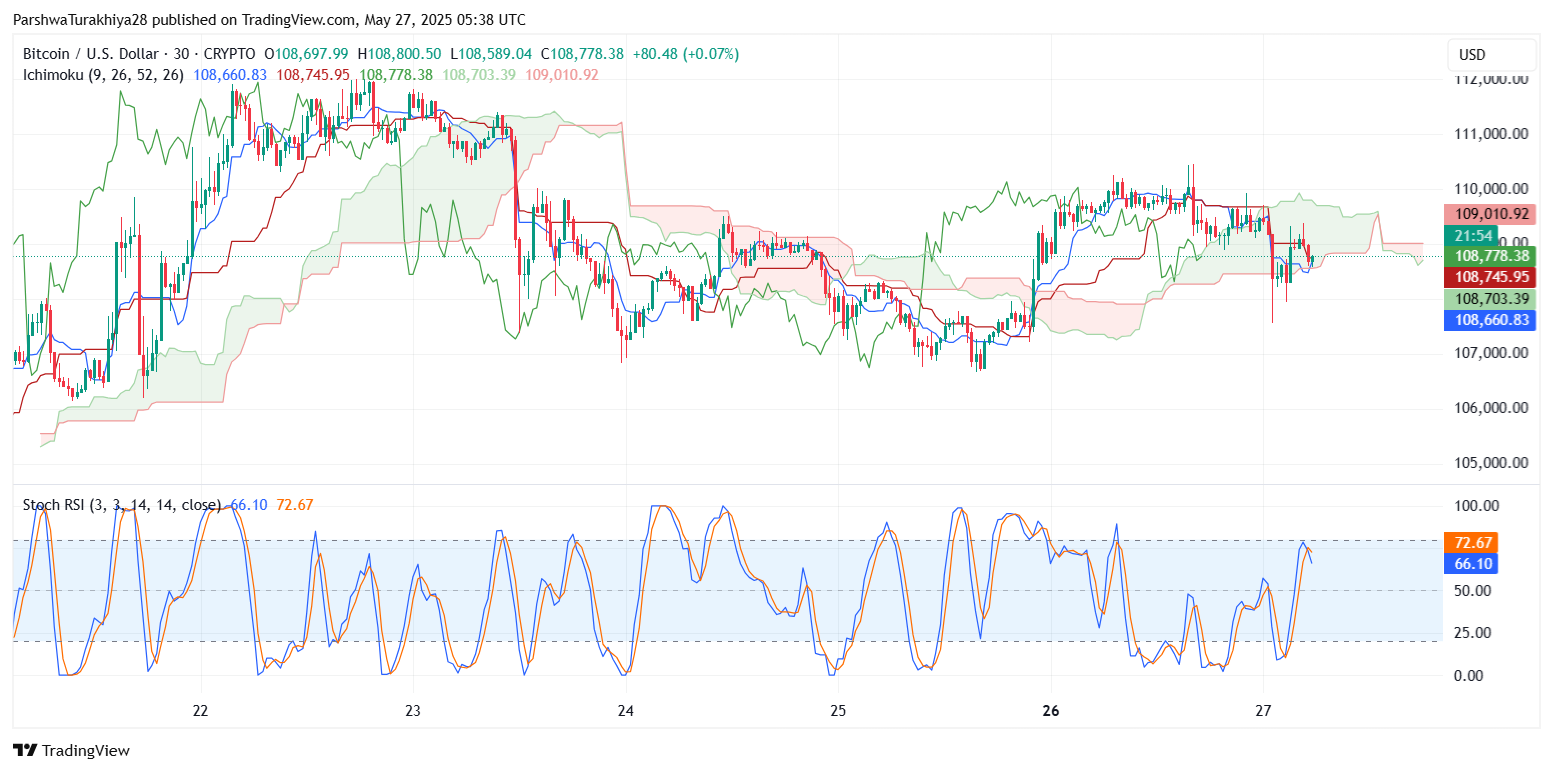
Looking at the Ichimoku Cloud on the 30-minute chart, price action is consolidating just inside the Kumo cloud after briefly dropping below the Tenkan-sen. The flat Kijun-sen around $108,750 is acting as magnetic support, while the Senkou Span A/B lines are beginning to flatten, reflecting indecision. Price is yet to flip the cloud bullish again, and a failure to break above $109.2K could lead to another dip toward the $107.5K–$106.8K demand zone.
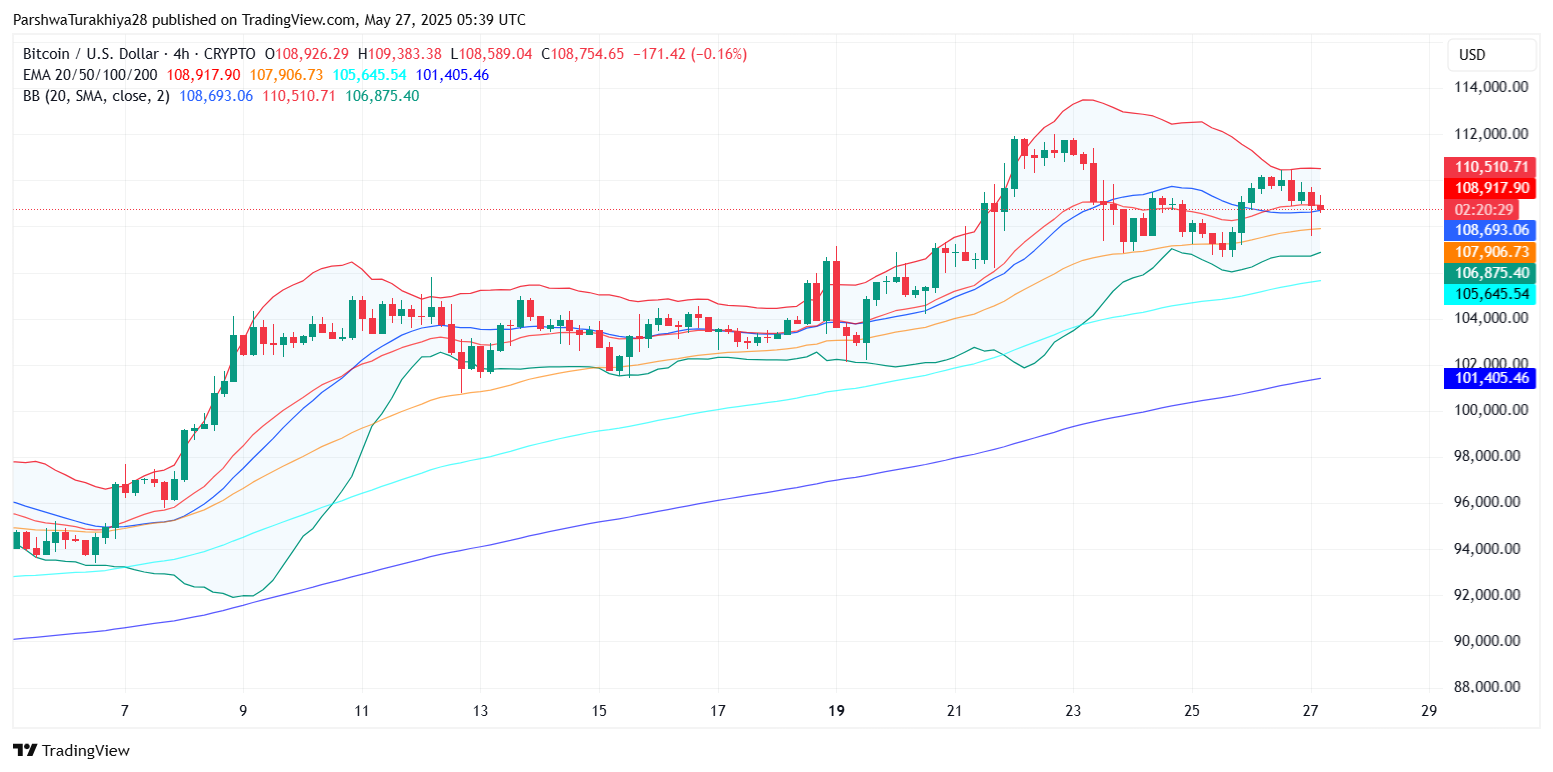
Bollinger Bands on the 4-hour chart show that price has pulled back from the upper band near $110.5K and is now resting around the mid-band level of $108.7K. The lower band is currently near $106.8K. This band compression, alongside declining volatility, often precedes strong directional moves.
Short-Term Forecast and Key Levels to Watch
BTC price analysis (Source: TradingView)
For now, the Bitcoin price today is showing signs of hesitation as it trades beneath triangle resistance and key short-term EMAs. Bulls need a decisive close above $110,600 to confirm breakout continuation, while a breakdown below $107,800 could open the gates to $105,500 or even $103,800.
The near-term structure leans neutral-bearish with a bias for corrective pullback unless a volume surge reclaims the $110K handle convincingly.
The current Bitcoin price update shows that the asset remains in a bullish macro structure, but short-term technicals suggest caution. Price is consolidating within a tight range, and a clean breakout or breakdown from this zone will likely set the tone for the rest of the week. If bulls fail to reclaim $110,600, further cooling toward $106K cannot be ruled out.
For now, expect Bitcoin price action to remain choppy with elevated volatility around key EMAs and demand zones. As long as $105,500 holds, the medium-term uptrend remains intact.
Disclaimer: The information presented in this article is for informational and educational purposes only. The article does not constitute financial advice or advice of any kind. Coin Edition is not responsible for any losses incurred as a result of the utilization of content, products, or services mentioned. Readers are advised to exercise caution before taking any action related to the company.


Leave a Reply