
XRP held steady on May 26, 2025, with its price positioned at $2.34, securing a market capitalization of $137 billion. With a 24-hour trade volume of $1.81 billion, XRP traded within an intraday range of $2.28 to $2.35, signaling investor caution amid technical indecision.
XRP
On the 1-hour chart, XRP demonstrated signs of recovery after bouncing from a localized low at $2.266, climbing toward the $2.36 resistance level. Volume data suggest potential accumulation near the recent dip, indicating that buyers are returning at these price levels. A short-term bullish continuation remains contingent on a decisive candle close above $2.36, ideally supported by an increase in trading volume.

XRP/USDC via Binance 1-hour chart on May 26, 2025.
The 4-hour chart reflects a consolidative structure following a short-term downtrend, with XRP showing the potential to form a higher low. The price action between $2.32 and $2.34 provides a compelling risk-reward entry for aggressive participants, pending bullish confirmation. A falling pattern is flattening, and declining volume hints at a transition phase, possibly toward a reversal. Bullish divergence observed in lower timeframes supports this view, with an upward move toward $2.45 plausible if momentum builds above the current level.
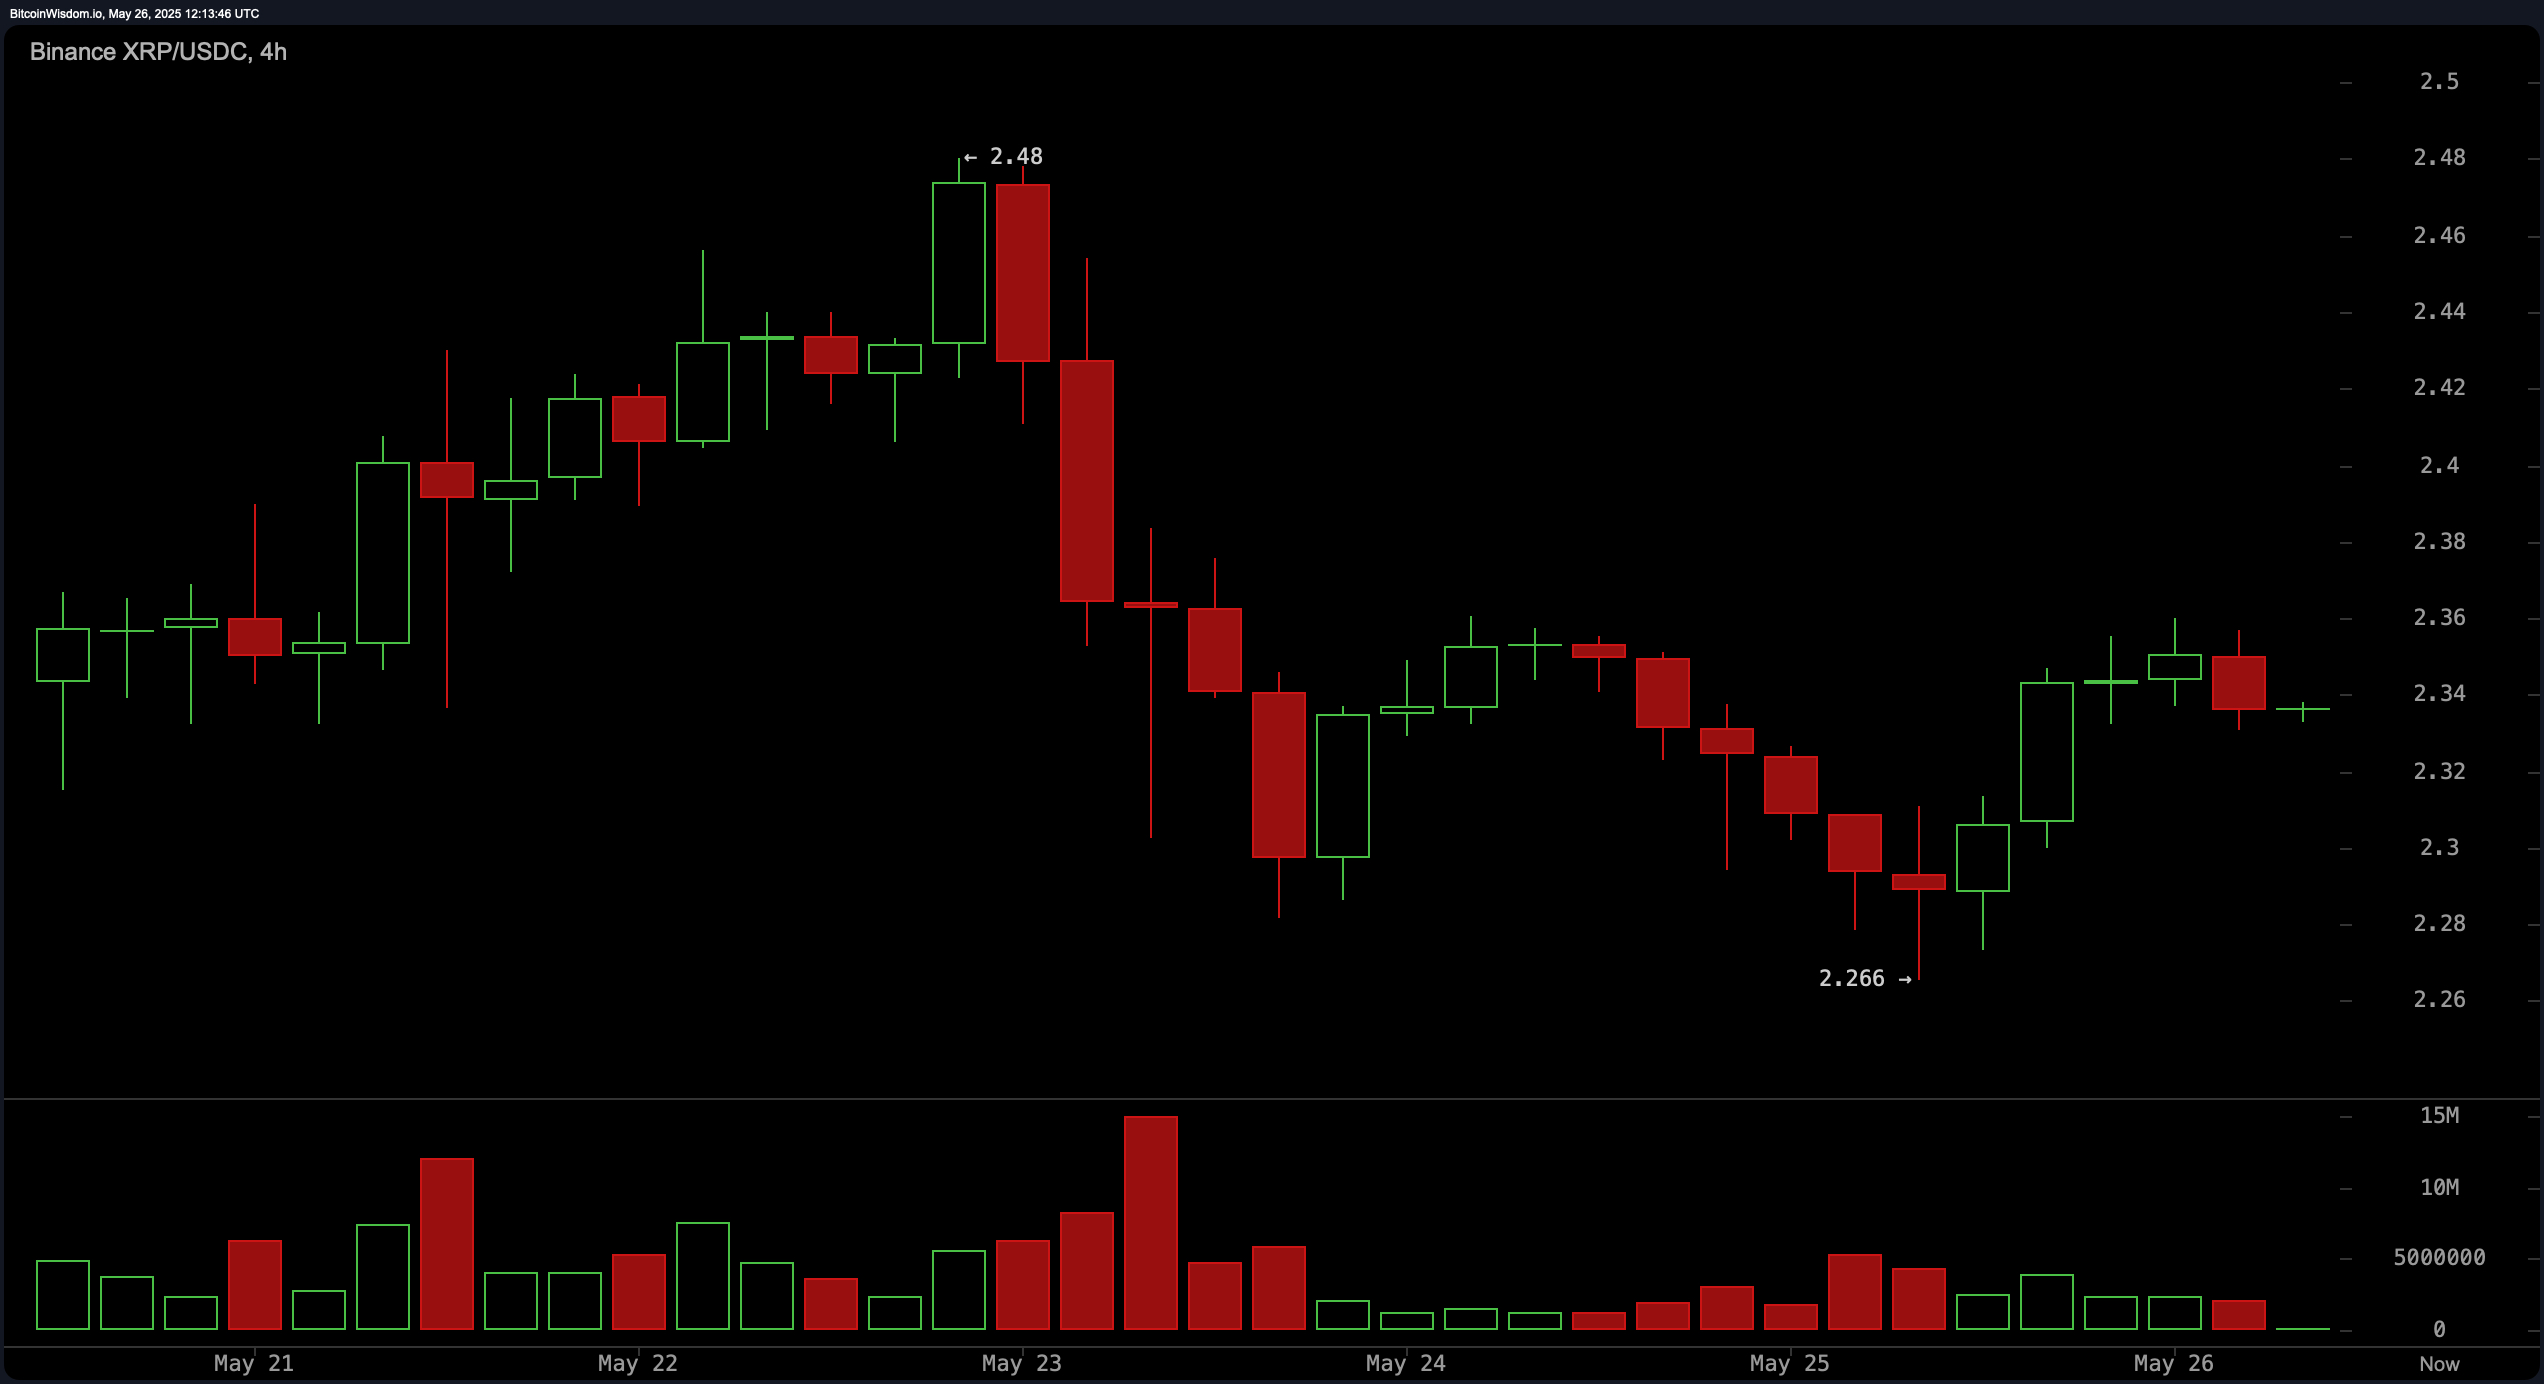
XRP/USDC via Binance 4-hour chart on May 26, 2025.
From a broader perspective, the daily chart depicts a retracement phase after a strong rally to $2.656 earlier in the month. Currently stabilizing between a support zone of $2.26 to $2.30 and resistance at $2.45 to $2.50, XRP is in a low-volatility consolidation phase. Traders watching this range may see long opportunities near $2.30 to $2.33, particularly with bullish candlestick confirmation. A downside break below $2.26 would invalidate bullish setups, while a push past $2.45 could signal a continuation toward previous highs.

XRP/USDC via Binance 1-day chart on May 26, 2025.
Oscillator indicators present a mixed technical signal. The relative strength index (RSI) at 50.27 is neutral, reflecting market equilibrium. The Stochastic oscillator at 16.90 gives a buy signal, suggesting short-term undervaluation. The Commodity Channel Index (CCI) at -40.58 and the average directional index (ADX) at 13.75 both imply a lack of strong trend momentum. Meanwhile, the Awesome oscillator shows a minor positive reading at 0.04639, but neither it nor the momentum indicator at -0.04354 supports aggressive bullish sentiment. The moving average convergence divergence (MACD) level at 0.02616 is in sell territory, indicating downward pressure may still be present.
Moving averages (MAs) further reinforce the technical neutrality. Both the 10-period exponential moving average (EMA) at $2.36057 and the simple moving average (SMA) at $2.36584 suggest selling pressure in the short term. However, support emerges in the medium to long term, with 30, 50, 100, and 200-period EMAs and SMAs all issuing buy signals. Notably, the 200-period EMA at $2.067 and 200-period SMA at $2.2601 imply a firm foundation at lower levels. This divergence between short- and long-term signals emphasizes the importance of confirmation and volume before initiating positions.
Bull Verdict:
If XRP can confirm a breakout above the $2.36 resistance with accompanying volume, the structure across the 1-hour and 4-hour charts supports a move toward the $2.45–$2.50 resistance zone. Strong support levels near $2.30 and broadly bullish longer-term moving averages reinforce the potential for continued upward momentum.
Bear Verdict:
Failure to hold the $2.30 support zone, especially a breakdown below $2.26 with rising volume, would invalidate bullish patterns and open the door to deeper retracements. The short-term bearish pressure from oscillators and key moving averages suggests that caution is warranted until a clearer directional move unfolds.


Leave a Reply