
XRP traded at $2.35 with a total market capitalization of $137 billion and a 24-hour trading volume of $1.75 billion. The intraday price ranged from $2.30 to $2.37, reflecting a narrow consolidation pattern indicative of indecisiveness across multiple timeframes.
XRP
The one-hour (1H) chart shows XRP recovering from a sharp drop from $2.457 to $2.282. This decline was followed by a series of higher lows, suggesting an accumulation phase. Price action has compressed into a narrow consolidation zone between $2.34 and $2.36, supported by low volume. Traders seeking short-term entries are watching for a breakout above $2.36, ideally confirmed by a strong green candlestick and increased volume. A potential entry strategy would include a stop-loss just below $2.30 and initial targets set at $2.42 and $2.47–2.48, marking previous resistance levels.
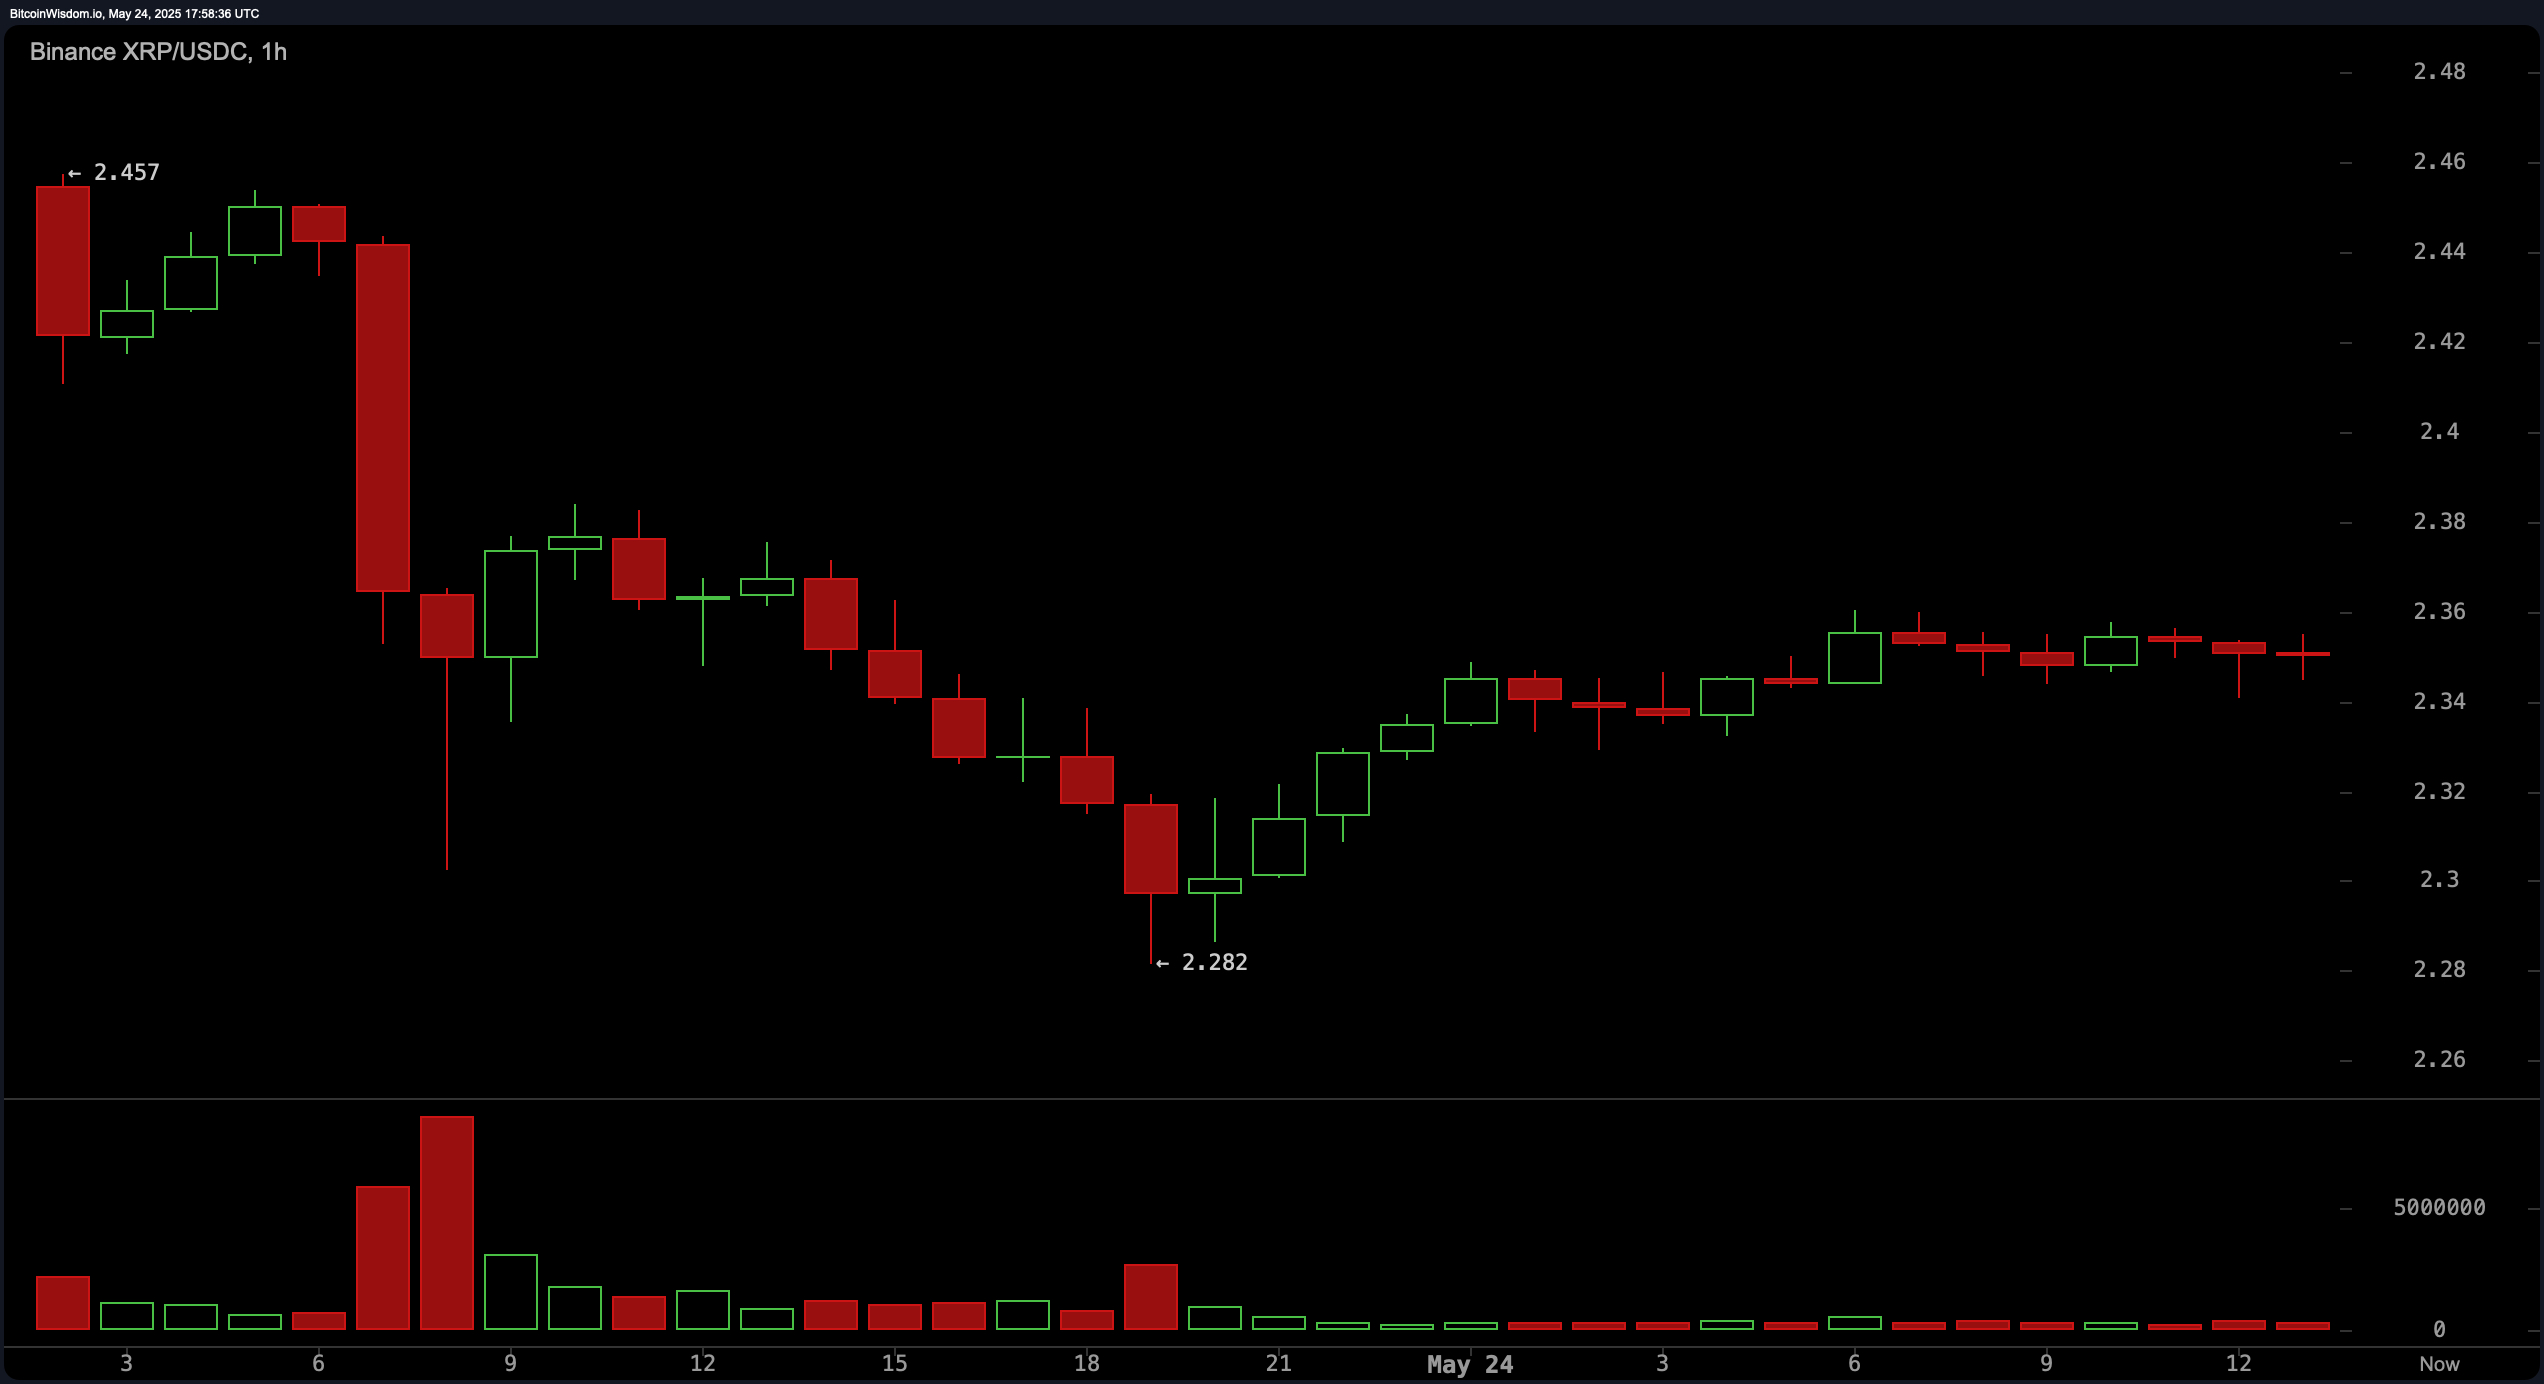
XRP/USDC via Binance 1H chart on May 24, 2025.
On the four-hour (4H) chart, XRP is attempting to stabilize following a recent low of $2.282 established on May 23. This level displayed a buying tail and quick rebound, suggesting it could serve as a short-term bottom. The asset is consolidating between $2.33 and $2.36, while the overhead resistance at $2.48, a prior lower high, remains formidable. An aggressive long entry may be considered if price breaks and retests the $2.37–2.38 area with confirming volume. A potential profit-taking zone lies near $2.47–2.48, aligning with historical supply zones.
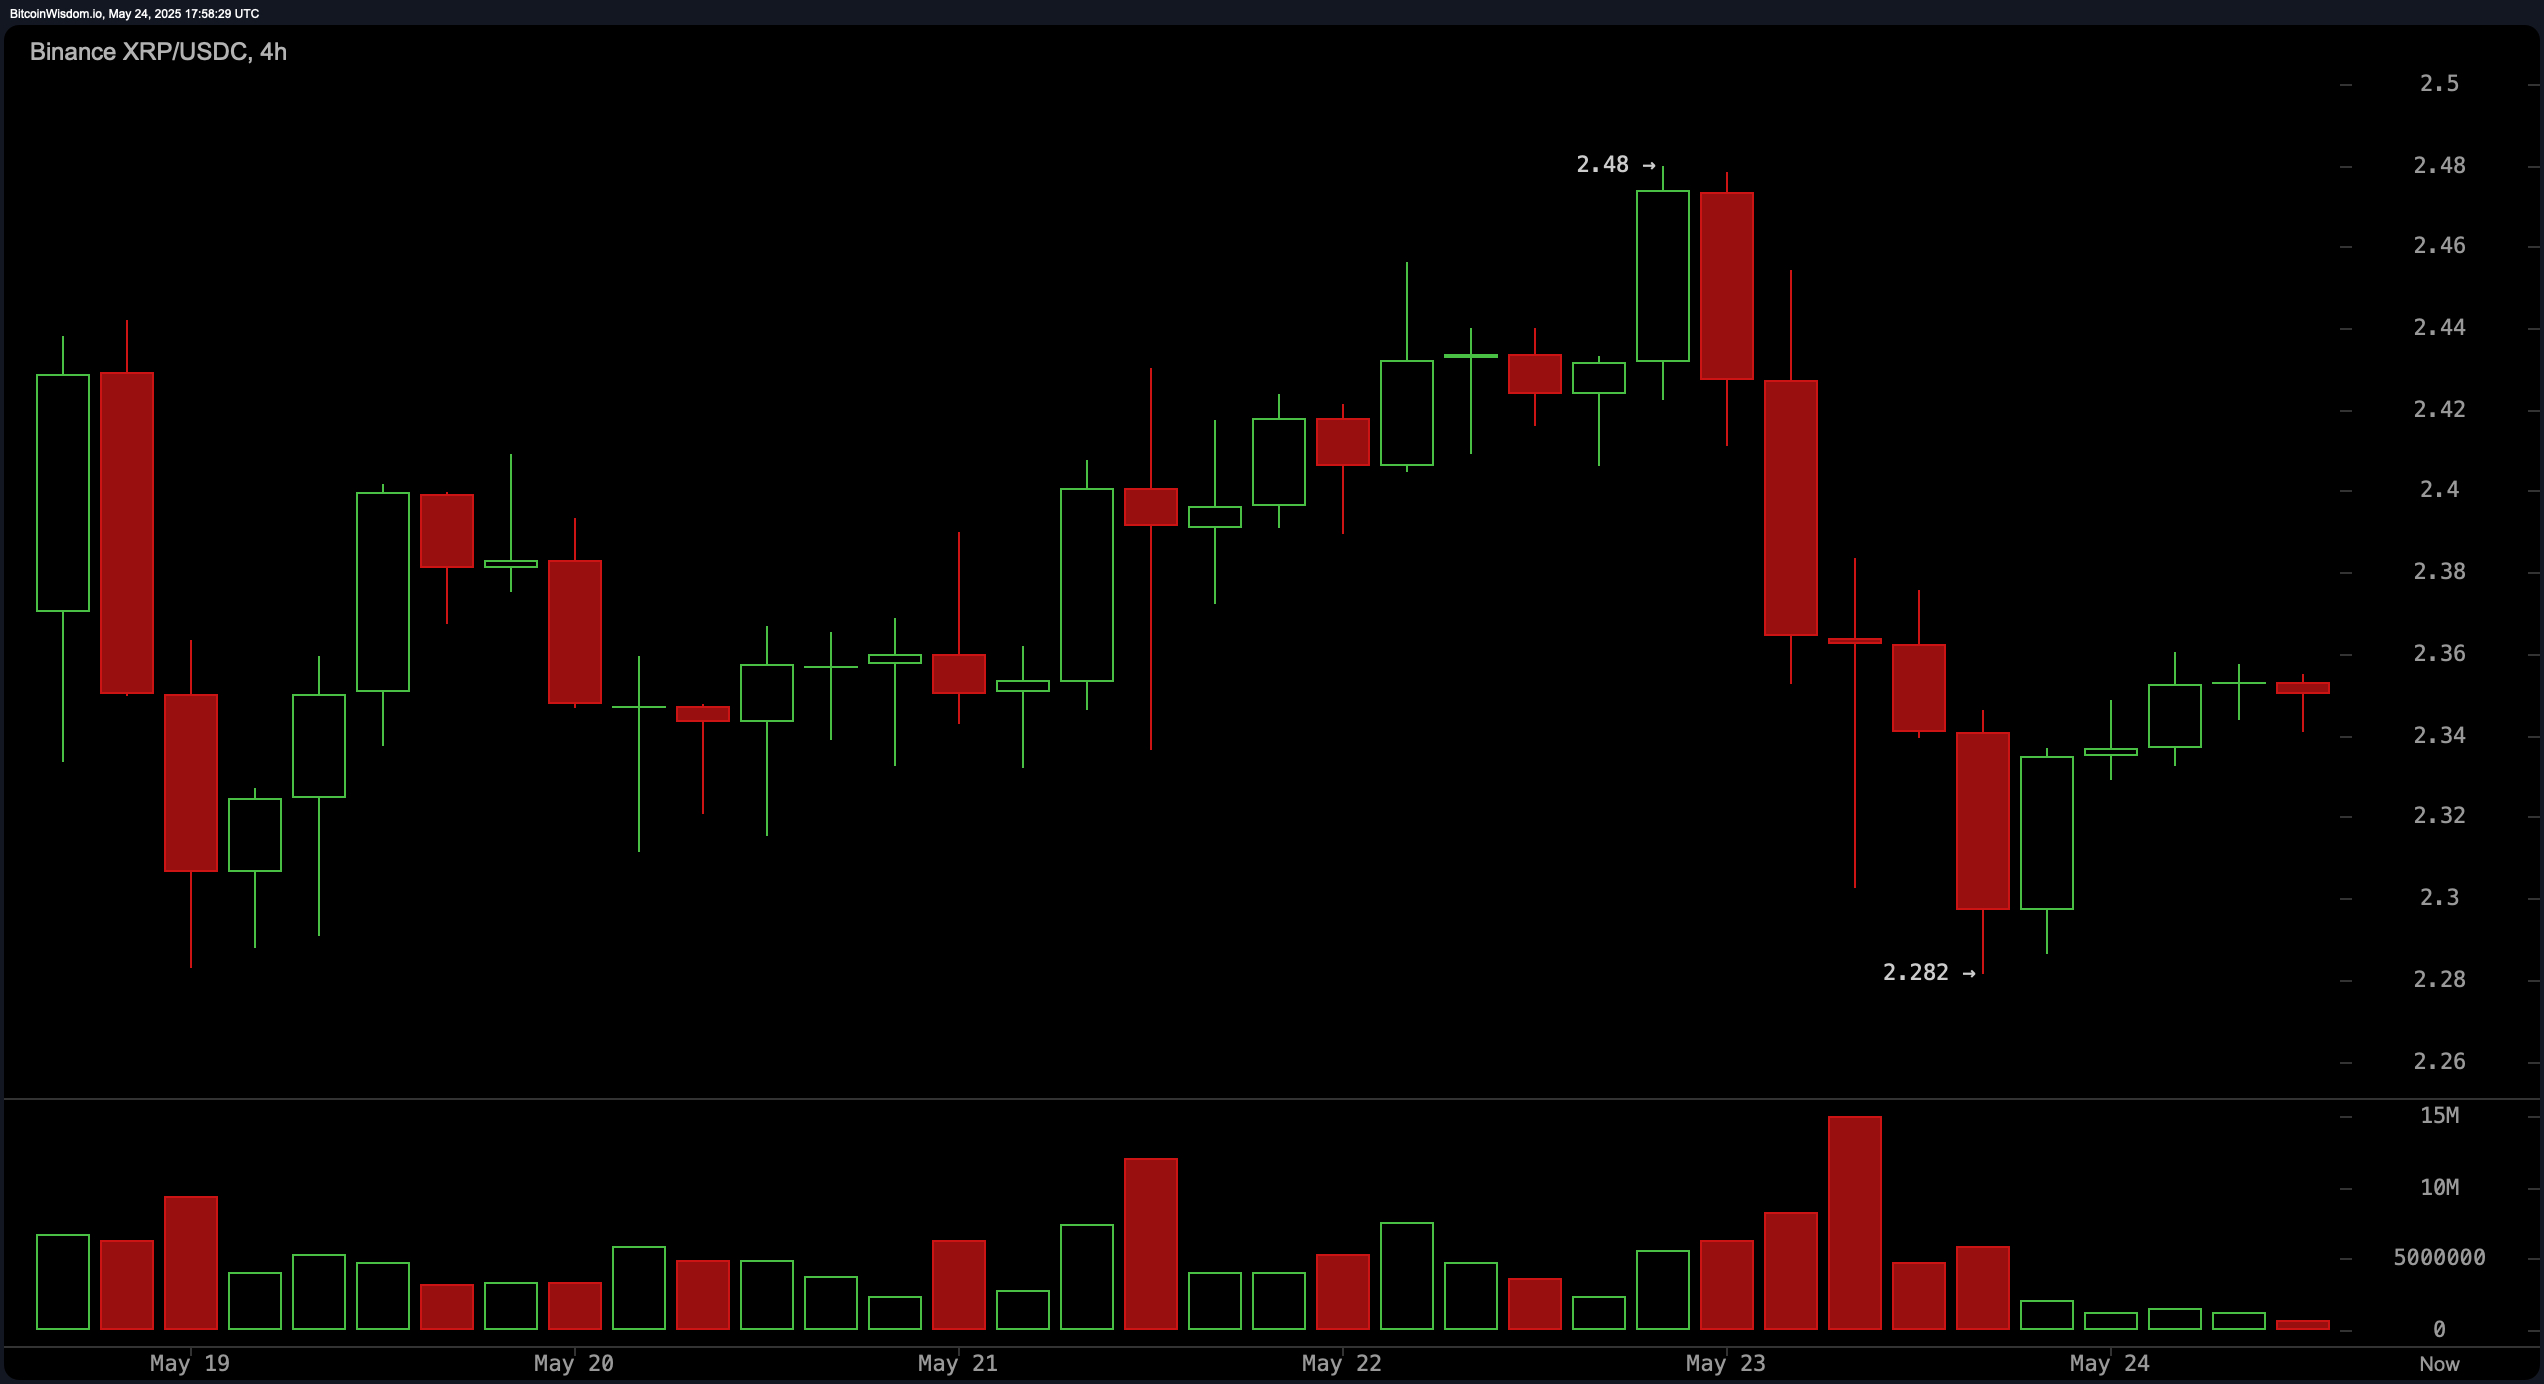
XRP/USDC via Binance 4H chart on May 24, 2025.
The daily (1D) XRP chart reveals a broader narrative of a strong rally that culminated in a local top at $2.656, followed by a pullback phase. A clear volume spike near the top suggests distribution, with smart money exiting positions. Price behavior currently features lower highs and candle patterns marked by indecision, such as smaller bodies with extended wicks. The support zone between $2.30 and $2.32 is being tested, with a critical buy zone forming between $2.25 and $2.30, contingent on a reversal candle confirmation. Resistance remains pronounced at $2.55–2.60, the peak before the recent correction.
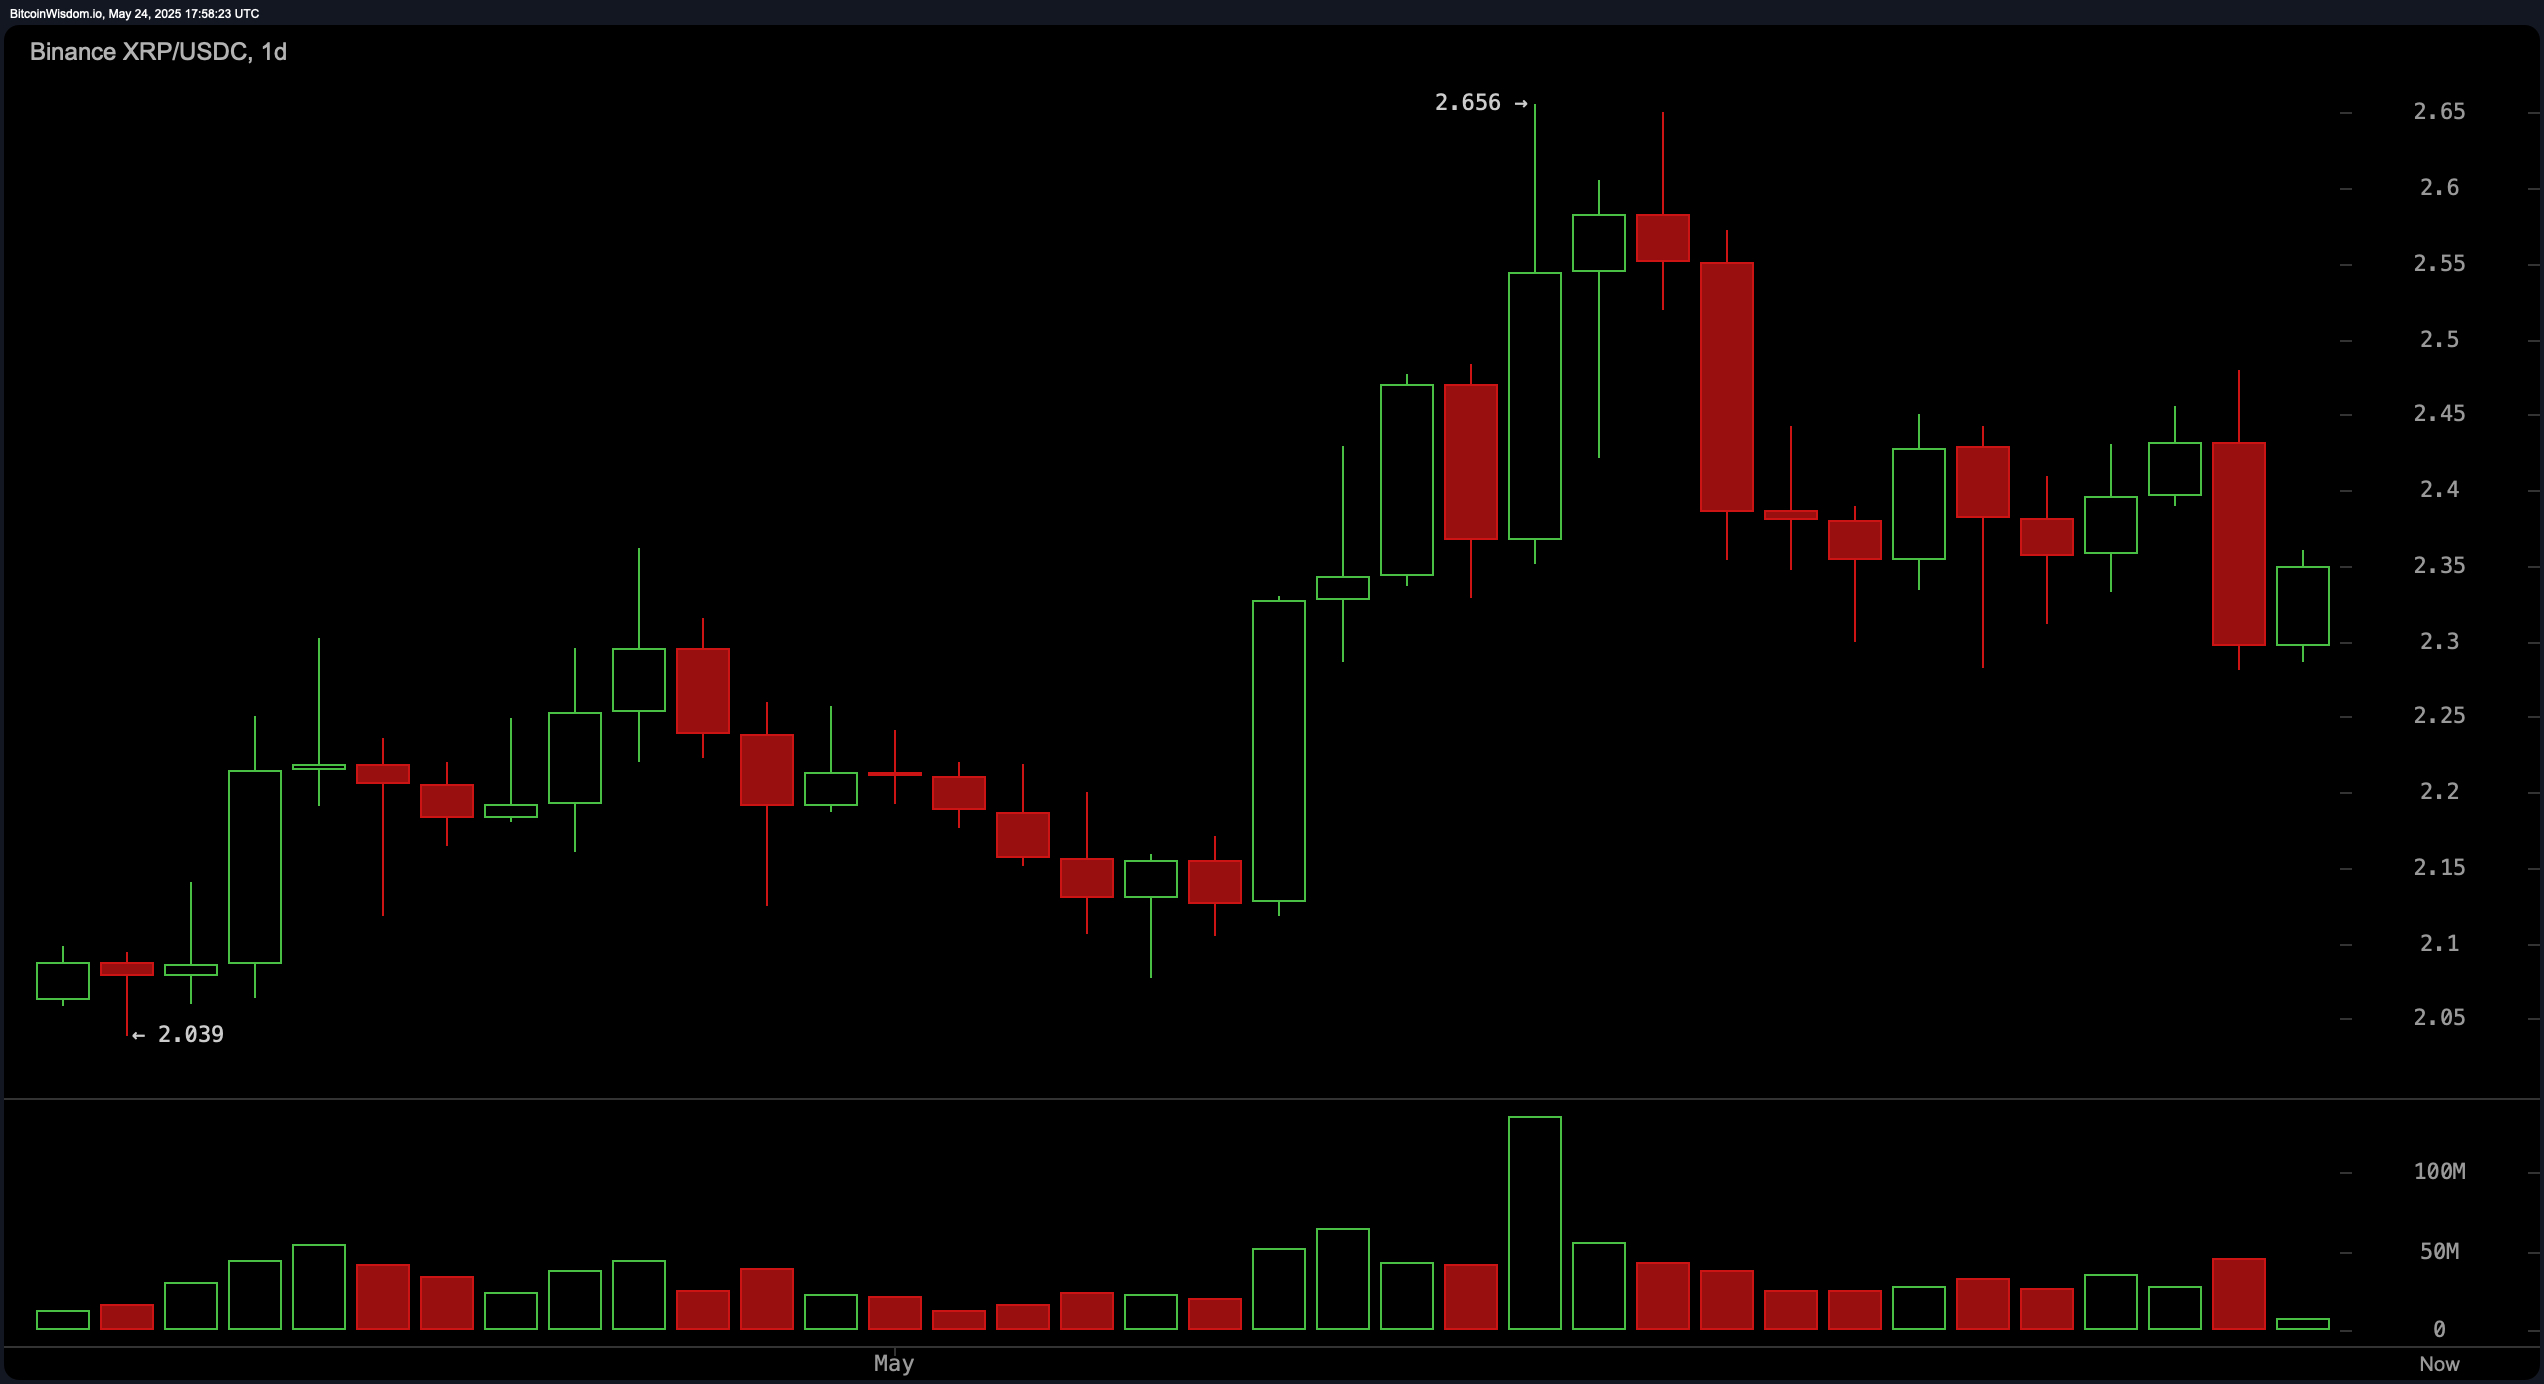
XRP/USDC via Binance 1D chart on May 24, 2025.
Oscillators across the board reflect a neutral to slightly bearish sentiment. The relative strength index (RSI) stands at 51.02, indicating a balance between buying and selling pressure. The Stochastic oscillator reads 20.02, which is on the cusp of oversold but still neutral. The commodity channel index (CCI, 20) is at -24.65, also neutral. The average directional index (ADX, 14) is weak at 15.56, suggesting a lack of trend strength. The Awesome oscillator records a modest 0.07627, while momentum at -0.20234 signals optimism. However, the moving average convergence divergence (MACD) shows a level of 0.03688, indicating a bearish signal, reinforcing mixed sentiment.
The moving averages (MAs) offer a more layered outlook. Short-term indicators such as the 10-period Exponential Moving Average (EMA) at $2.37388 and the 10-period Simple Moving Average (SMA) at $2.37612 both signal negativity. The 20-period EMA and SMA echo this bearish outlook. However, the 30-period EMA at $2.32562 and SMA at $2.31615 suggest bullish activity, indicating that support may be forming around those levels. Longer-term indicators present a distinctly bullish bias: the 50-period EMA at $2.29813 and SMA at $2.21741, the 100-period EMA at $2.26846 and SMA at $2.29522, and the 200-period EMA at $2.06165 and SMA at $2.24228 all point to positive signals. This layered structure supports a potential longer-term uptrend if immediate resistance zones can be breached with volume.
Bull Verdict:
If XRP maintains support above the $2.30–$2.32 range and breaks above $2.37 with accompanying volume, the bullish structure remains intact. Layered support from mid- to long-term moving averages and signs of accumulation on lower timeframes support a potential continuation toward $2.47 and beyond. A confirmed reversal on the daily chart could propel XRP back to retest the $2.55–$2.60 resistance range.
Bear Verdict:
Failure to hold the $2.30 support, especially on increasing volume, may indicate that the recent consolidation is a pause before further downside. With short-term moving averages signaling weakness and the MACD suggesting continued bearish momentum, a breakdown below $2.25 could open the path toward $2.15 or lower. Until bullish confirmation emerges, caution is advised.


Leave a Reply