
XRP traded at $2.43 today with a market capitalization of $142 billion and a 24-hour trading volume of $3.754 billion. The intraday price range fluctuated between $2.35 and $2.45, positioning the asset near local highs and prompting close attention from technical analysts.
XRP
Short-term chart analysis of the 1-hour timeframe reveals XRP is currently undergoing minor consolidation just beneath the $2.45 resistance level. The structure supports a bullish microtrend that advanced from $2.33 to $2.45, underscored by a volume spike during a recent red candle, which may indicate a shakeout. Traders may view a pullback toward the $2.38 to $2.40 zone—accompanied by bullish candlestick patterns—as a potential entry point.
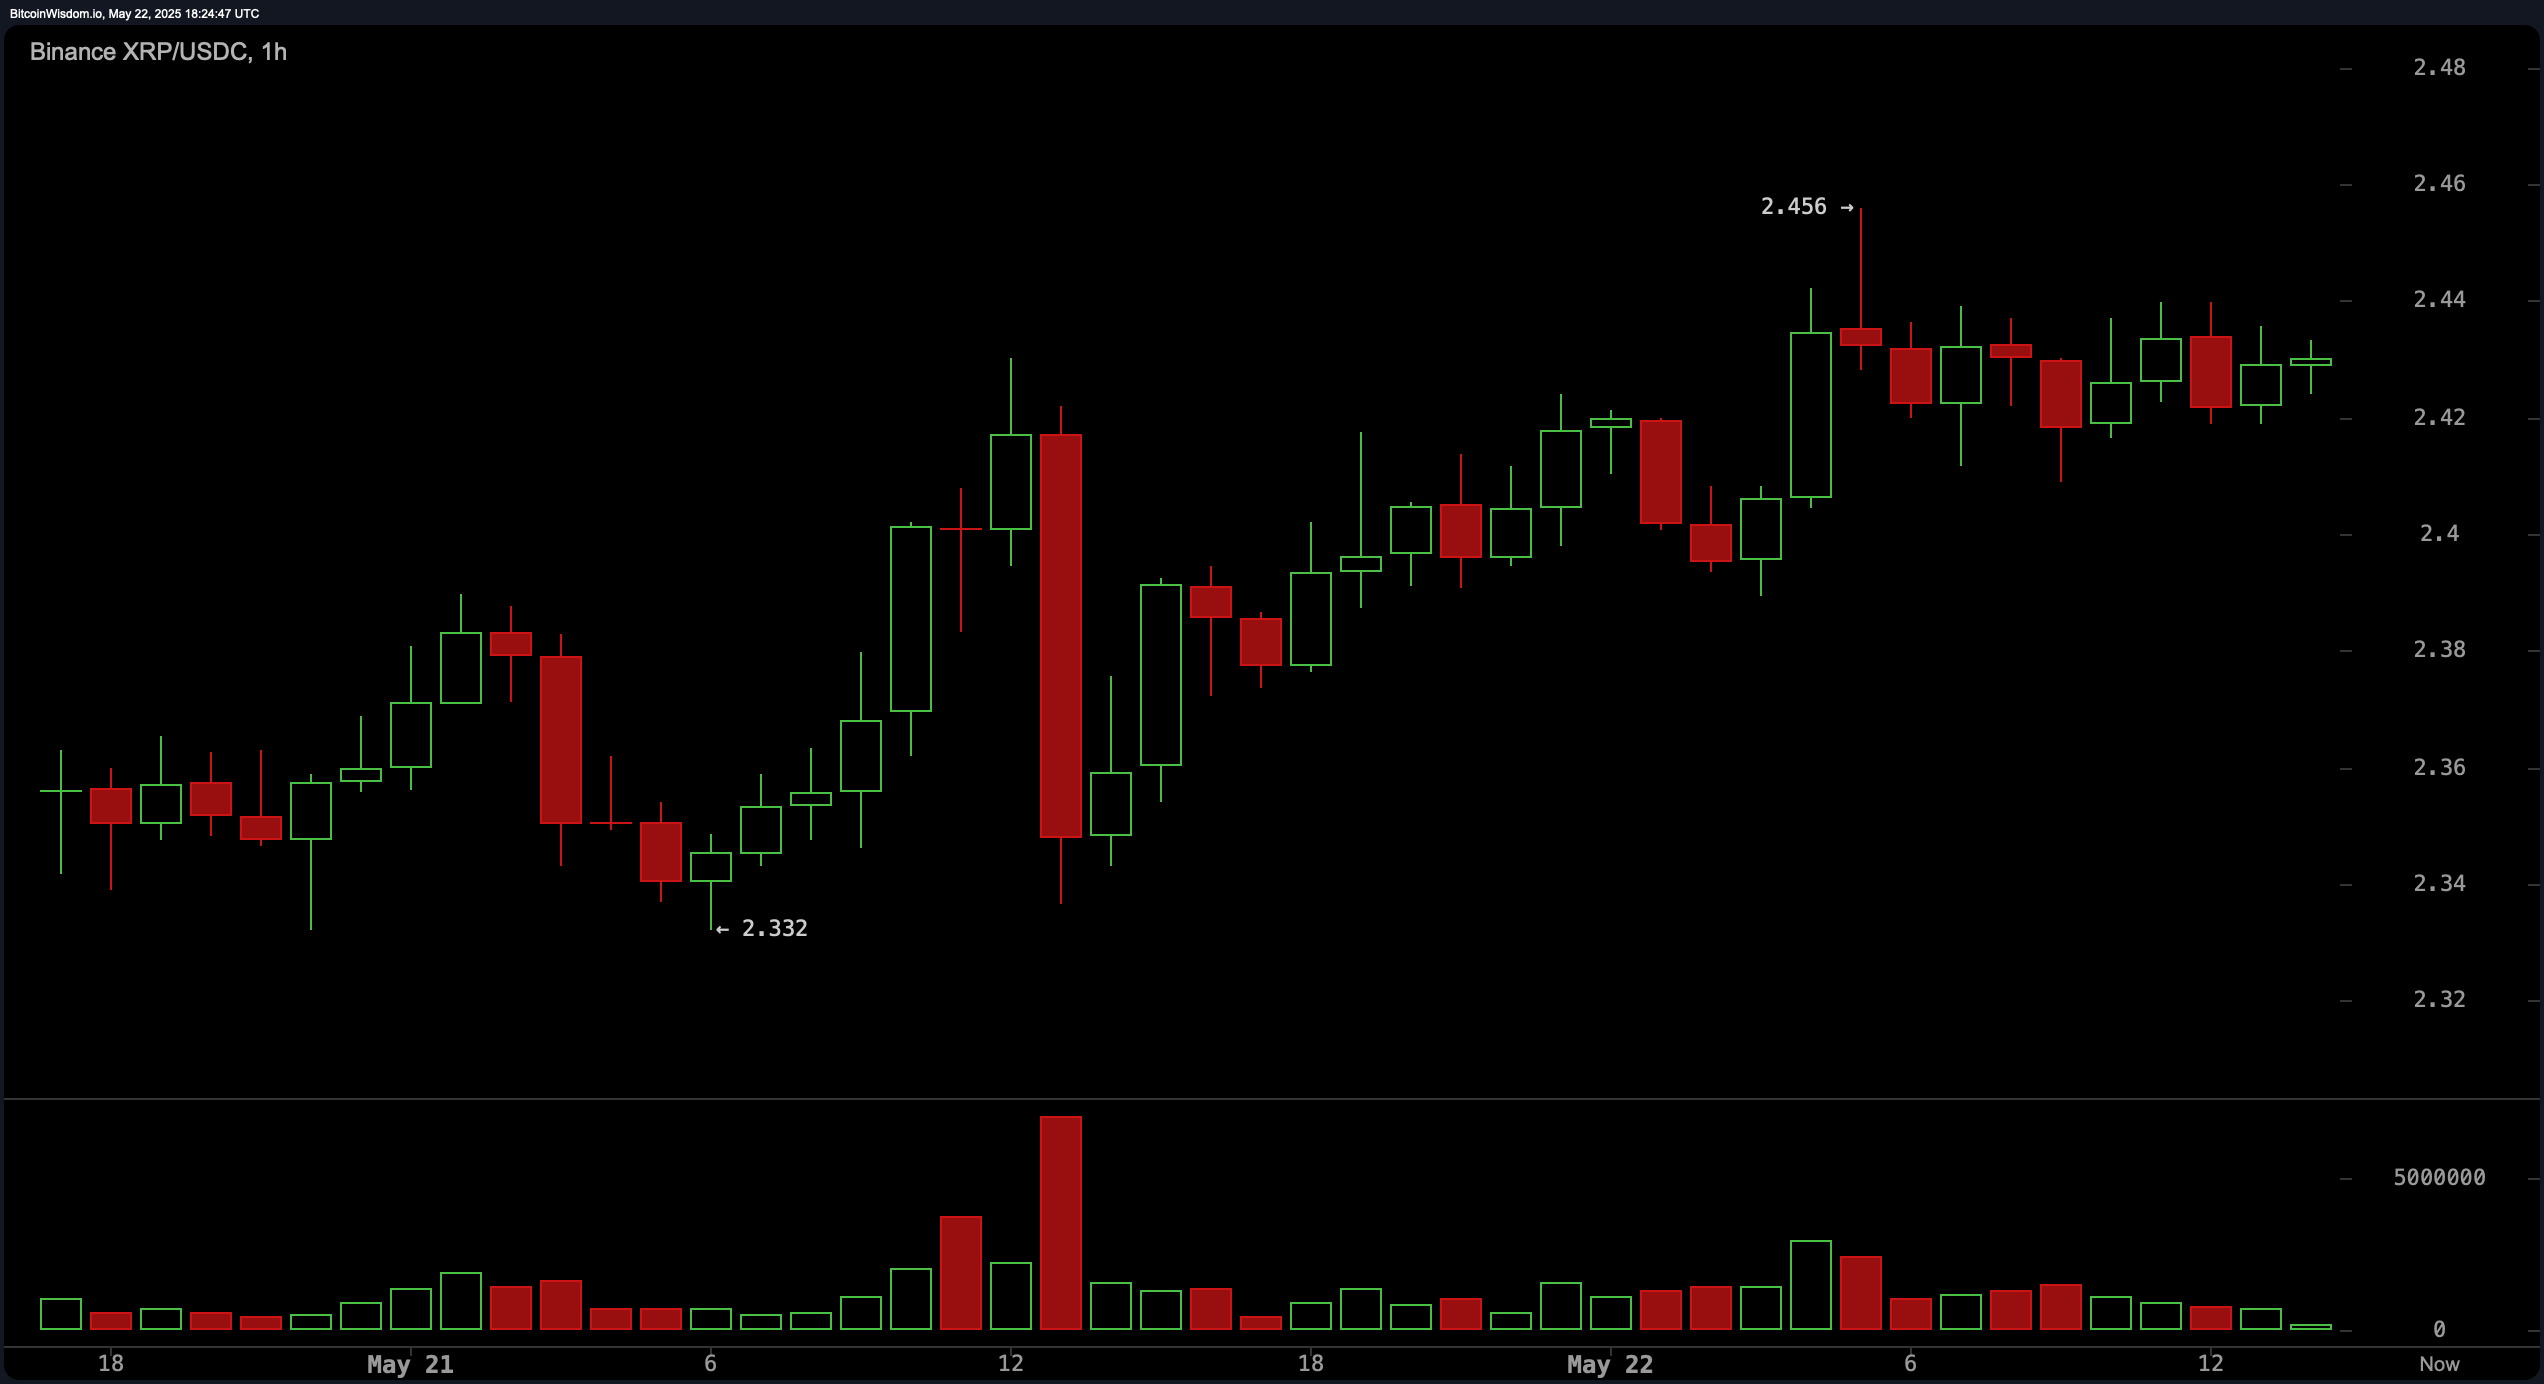
XRP/USDC via Binance 1-hour chart on May 22, 2025.
The 4-hour chart shows a more structured recovery following a bottom near $2.28. The price action is forming a potential ascending triangle, a classically bullish pattern, with multiple tests of the $2.44 resistance area. Should XRP break out above $2.45 and confirm the move with a retest, it would likely initiate a continuation of the upward trajectory. However, a failure to maintain above $2.45 and a subsequent drop below $2.36 could lead to a retest of the $2.28 support.
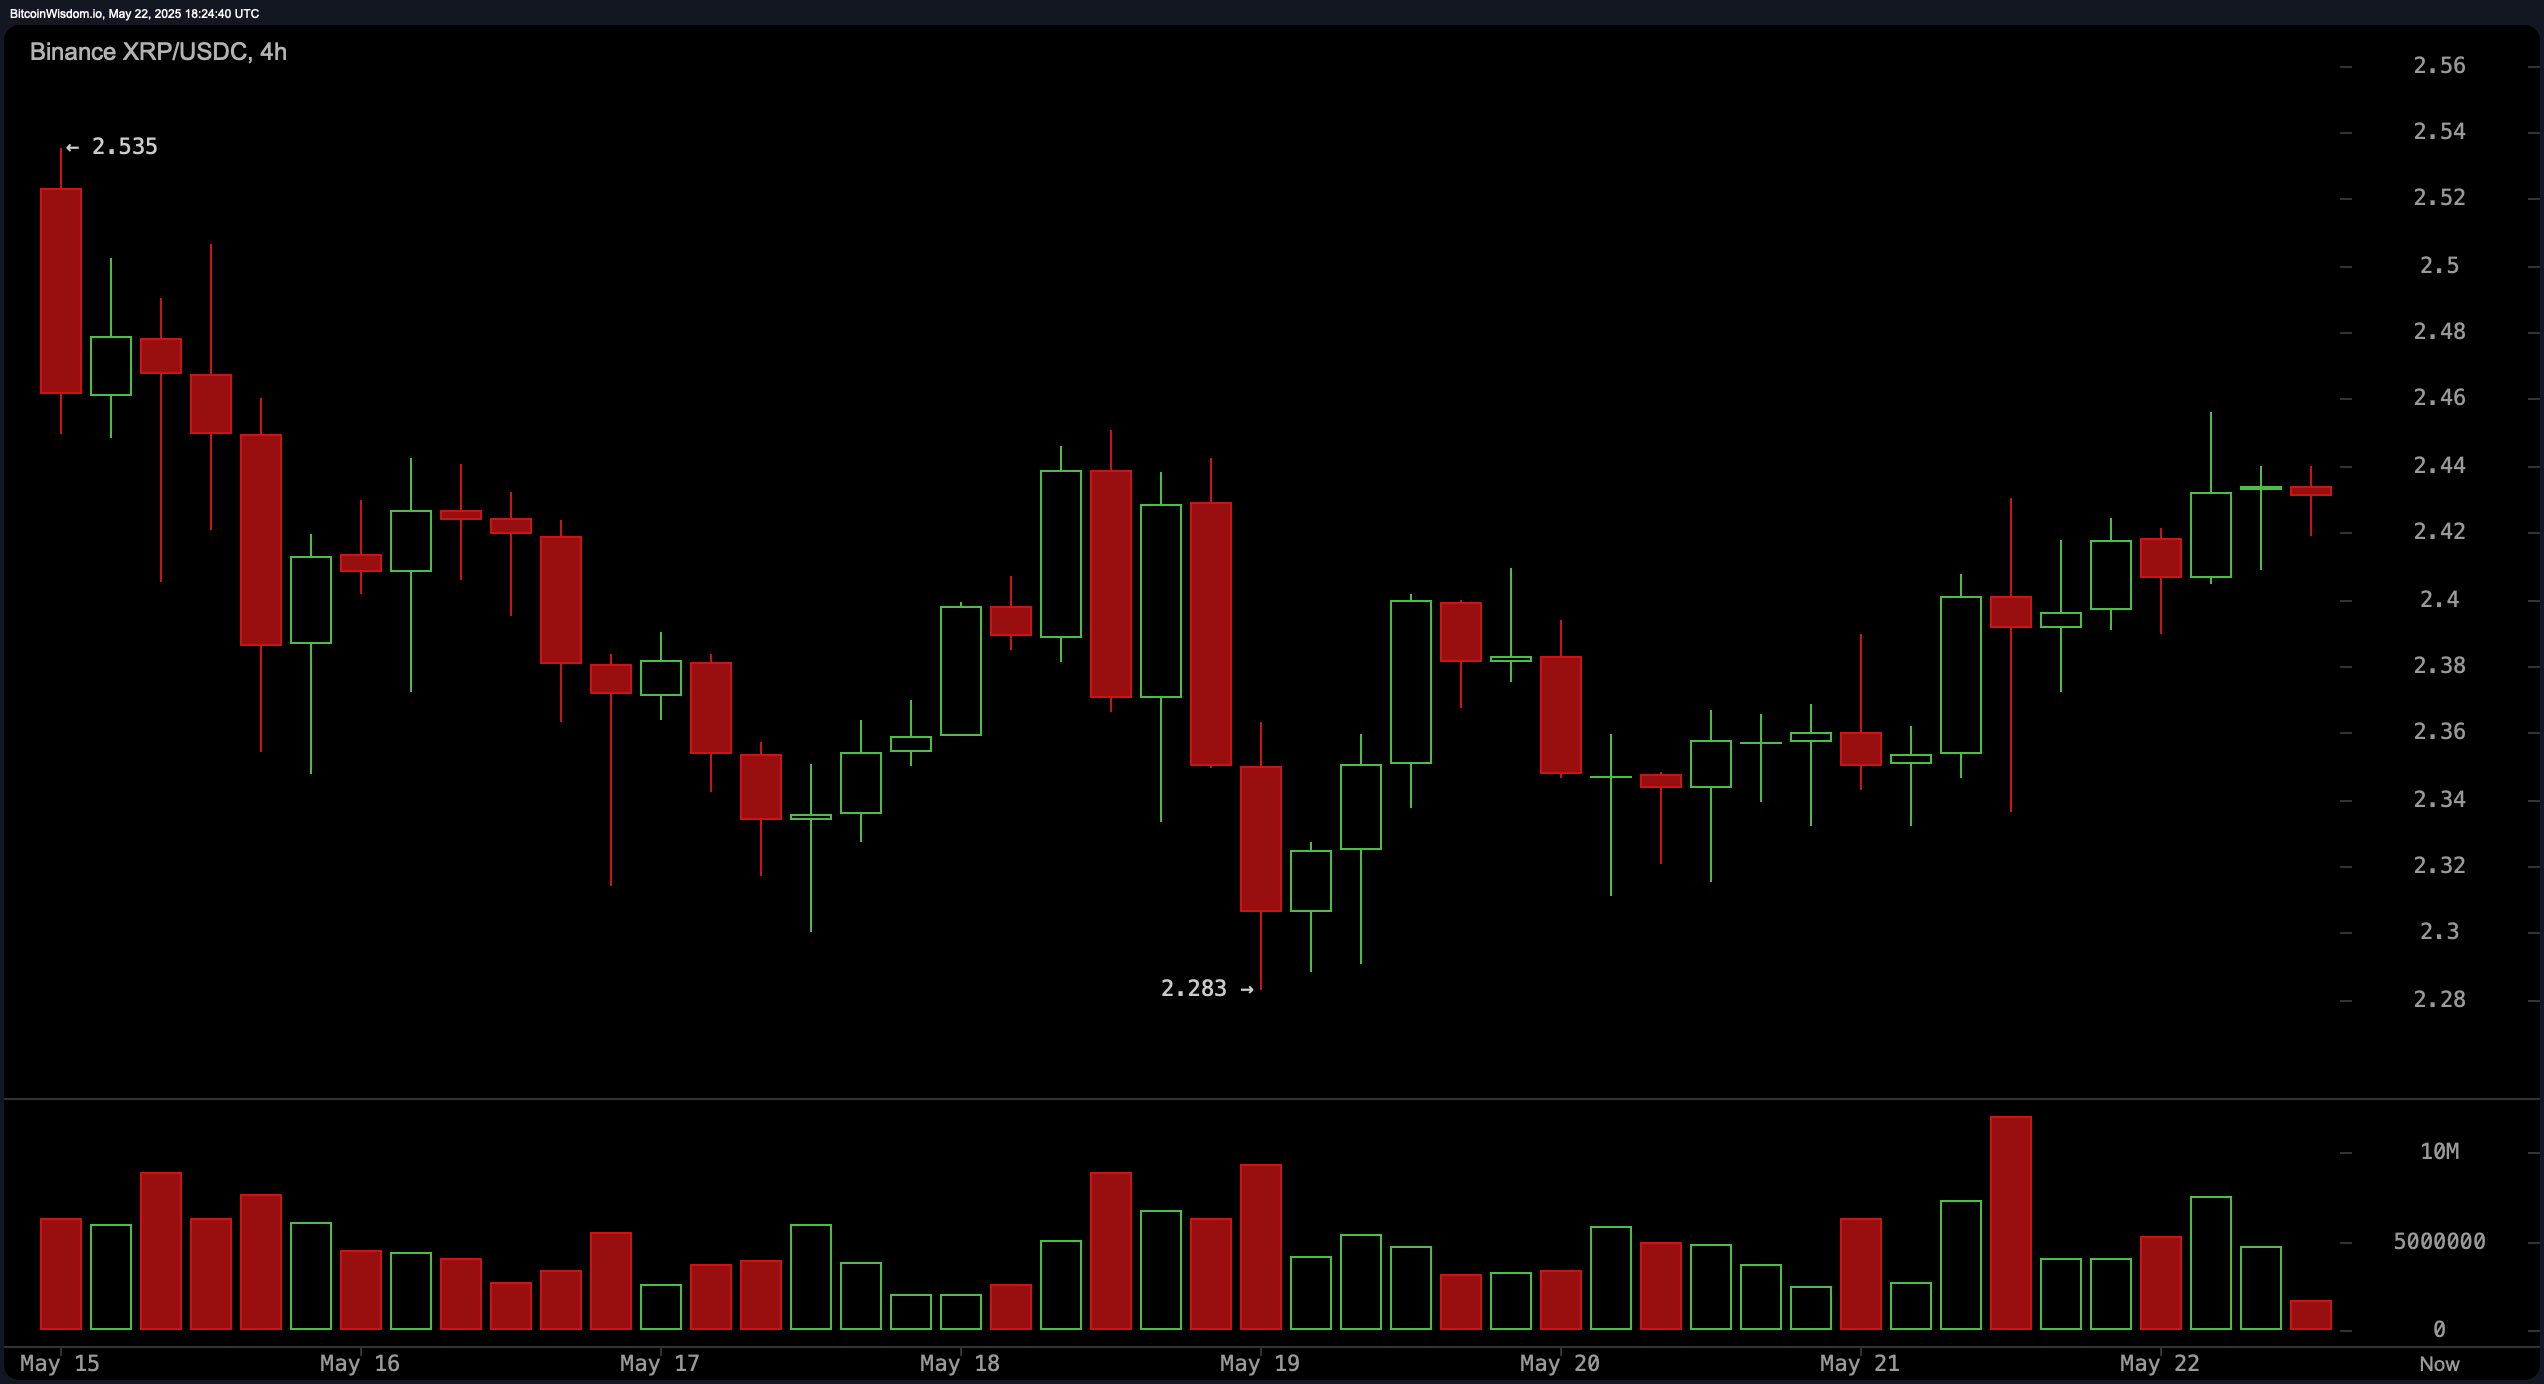
XRP/USDC via Binance 4-hour chart on May 22, 2025.
From a broader daily perspective, XRP’s price action reflects a strong rally from approximately $1.61 to $2.656, followed by a consolidation phase forming what resembles a bullish flag or pennant. Volume increased significantly during the rally but has since tapered during the consolidation, which is common in continuation patterns.
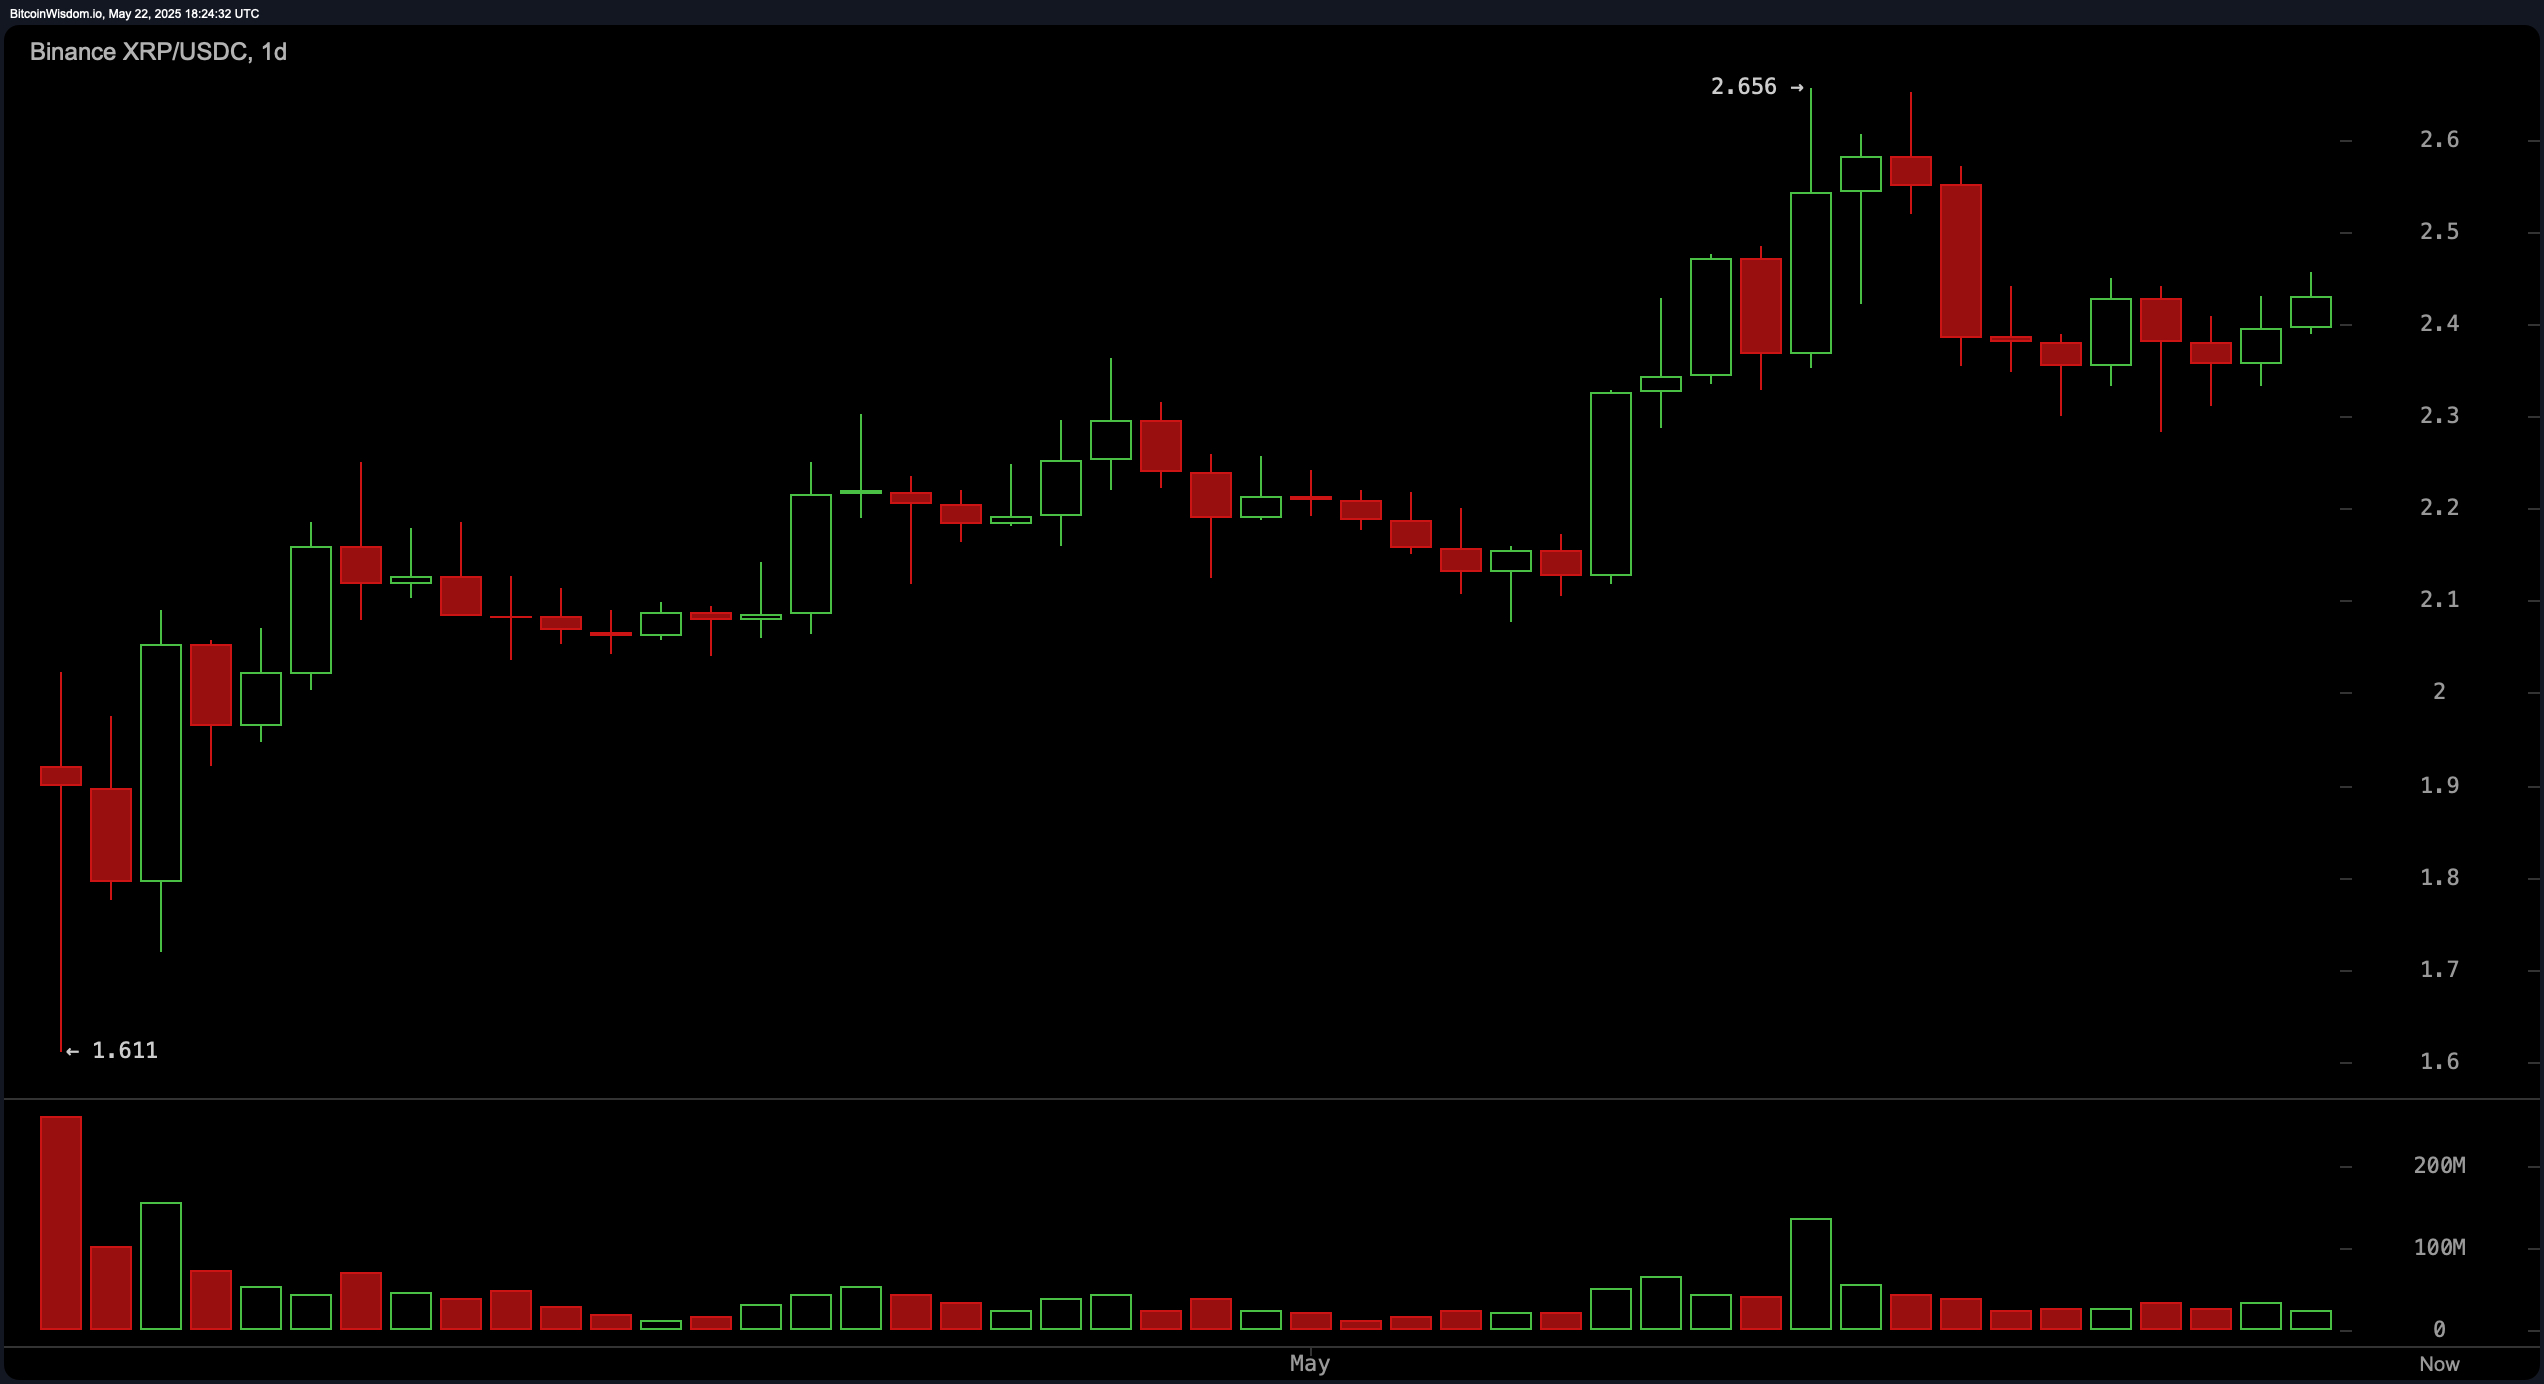
XRP/USDC via Binance 1-day chart on May 22, 2025.
Oscillators currently show a predominantly neutral stance across various indicators. The relative strength index (RSI) at 56.50687, stochastic %k at 45.18296, commodity channel index (CCI) at 48.17675, and average directional index (ADX) at 17.97099 all signal a lack of decisive momentum. The awesome oscillator issues a buy signal at 0.10239, but this is countered by sell indications from the momentum indicator at −0.11690 and the moving average convergence divergence (MACD) level at 0.05354, reflecting underlying market indecision.
In contrast, moving averages present a strongly bullish bias. The exponential moving averages (EMA) and simple moving averages (SMA) for 10-, 20-, 30-, 50-, 100-, and 200-period spans all issue buy signals. This widespread alignment suggests that despite short-term oscillatory hesitance, the medium- and long-term trend remains upward, reinforcing the case for a potential breakout pending favorable volume and market sentiment.
Bull Verdict:
XRP displays strong technical resilience with bullish patterns evident across multiple timeframes, including a potential ascending triangle on the 4-hour chart and a bullish flag on the daily chart. The consistent buy signals from all key moving averages, coupled with price consolidation near local highs, suggest the potential for a breakout above $2.50–$2.55. If supported by volume, XRP could retest previous highs near $2.65–$2.70, validating a bullish continuation.
Bear Verdict:
Despite an overall bullish structure, caution is warranted due to the neutral-to-bearish signals from key oscillators such as the momentum indicator and MACD. A failure to break above $2.45 combined with a drop below the $2.30 support zone may trigger a deeper correction, potentially invalidating short-term bullish setups. A shift in broader market sentiment, particularly from Bitcoin, could also accelerate downside risks for XRP.


Leave a Reply