
Ethereum bulls are attempting to stretch their winning streak into May 24, with the Ethereum price pushing past short-term consolidation and nearing critical resistance. After consolidating for much of the past week, ETH has surged more than 7% over the last 48 hours and is now trading just below a key psychological level that may decide the next leg of its trend.
Highlights:
- Ethereum price today is trading around $2,724 after testing intraday highs near $2,733
- MACD crossover and Ichimoku breakout suggest bullish continuation, but RSI nears overbought zone
- Key support lies at $2,685; resistance overhead at $2,745 and $2,800 remains unbroken
What’s Happening With Ethereum’s Price?
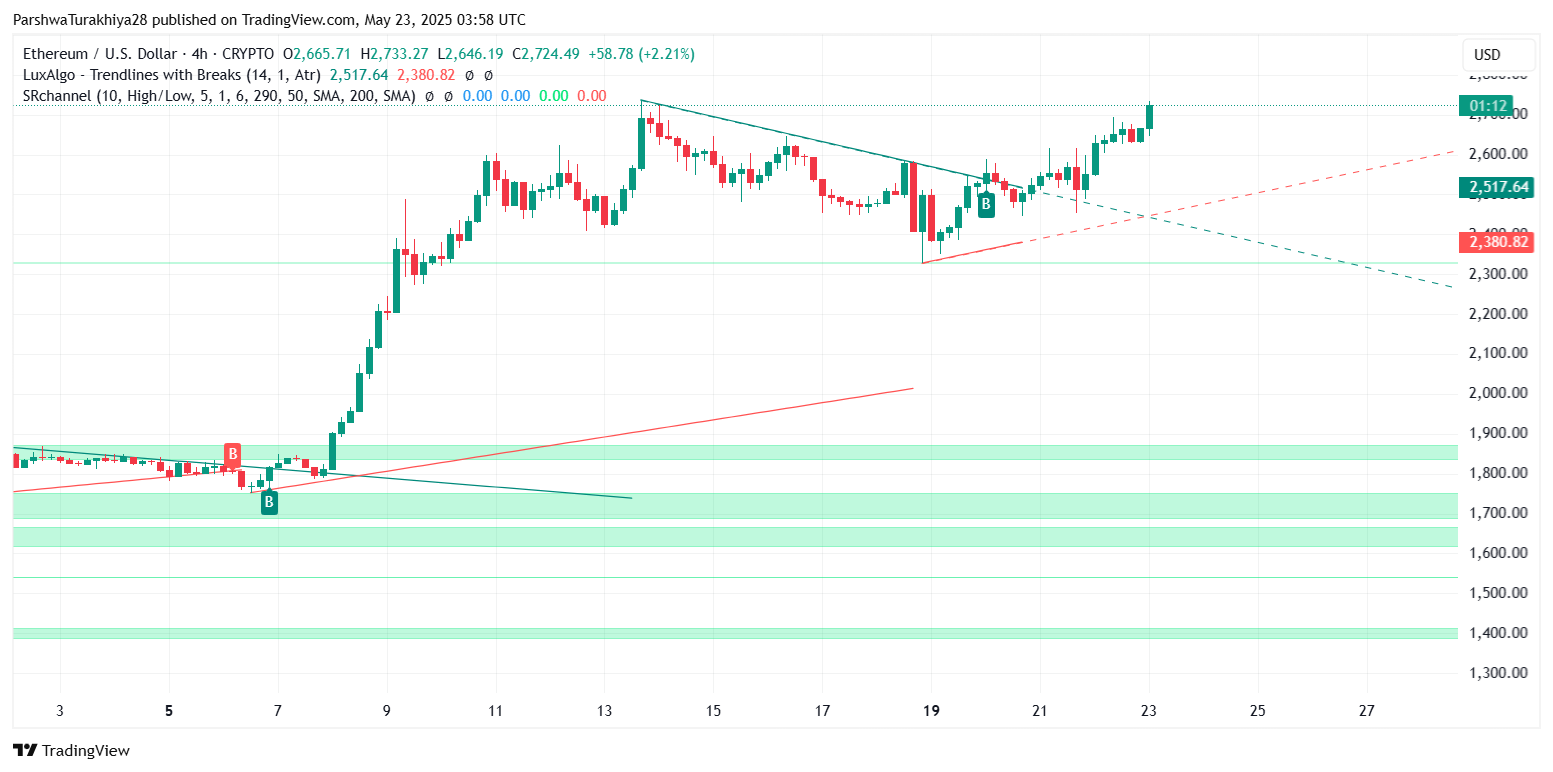
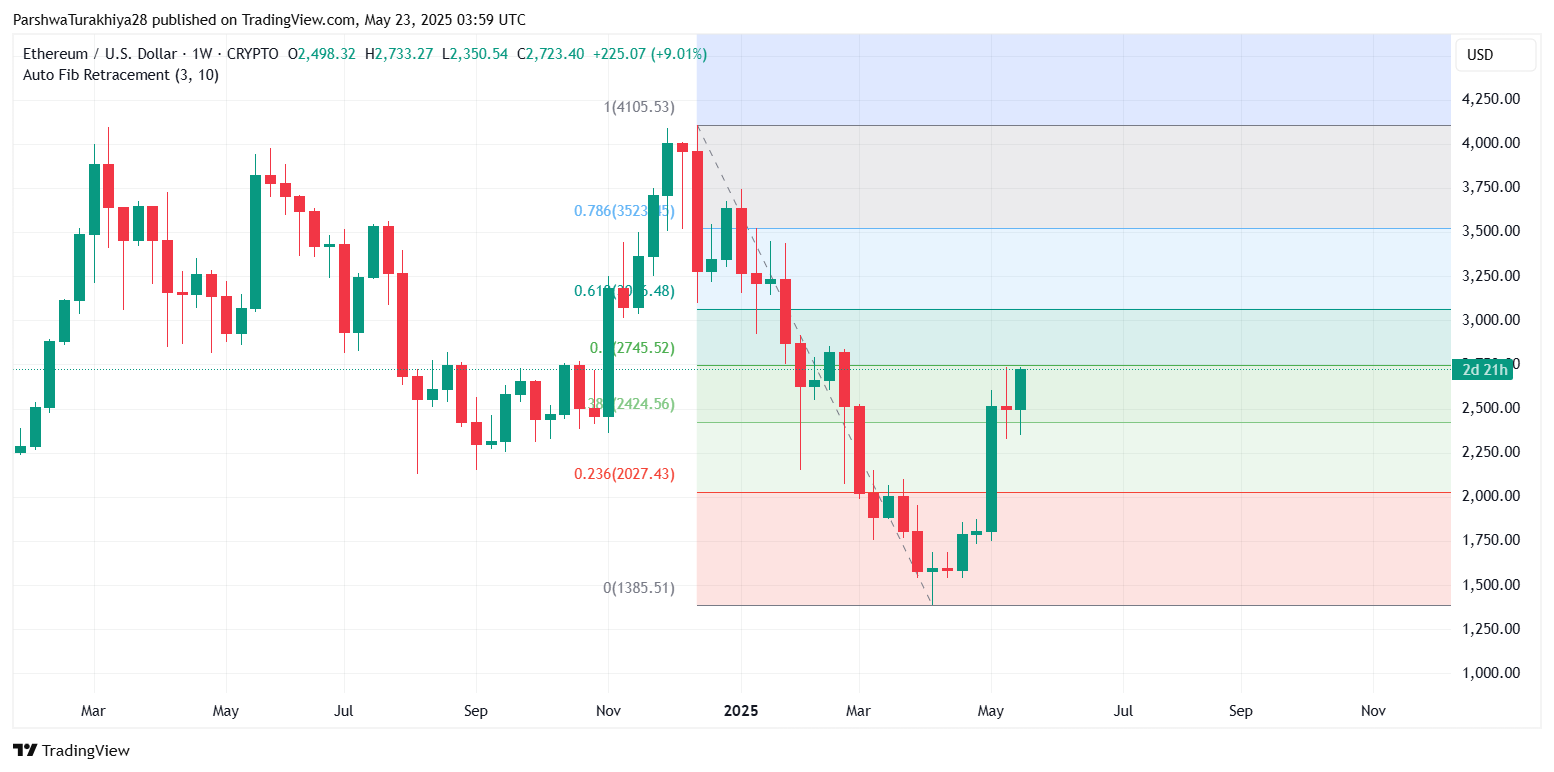
The Ethereum price today is trading near $2,724, up roughly 0.5% intraday, and attempting to solidify its breakout from the $2,680–$2,690 resistance band. On the 4-hour chart, ETH has made a decisive move above the Bollinger mid-band and the 20/50 EMA clusters, indicating rising trend strength. However, the price is now sitting just under the Fibonacci 0.0 level at $2,745.52—retraced from the $4,105 high to $1,385 low—marking a crucial resistance.
The Ethereum price action since the May 22 breakout has been supported by strong bullish momentum, and today’s structure reflects a textbook continuation pattern as long as price holds above the $2,685–$2,700 support zone. That said, multiple indicators now suggest ETH is entering a “watch zone” where overextension could trigger short-term volatility.
RSI, MACD Signal Strength—But Exhaustion May Be Near
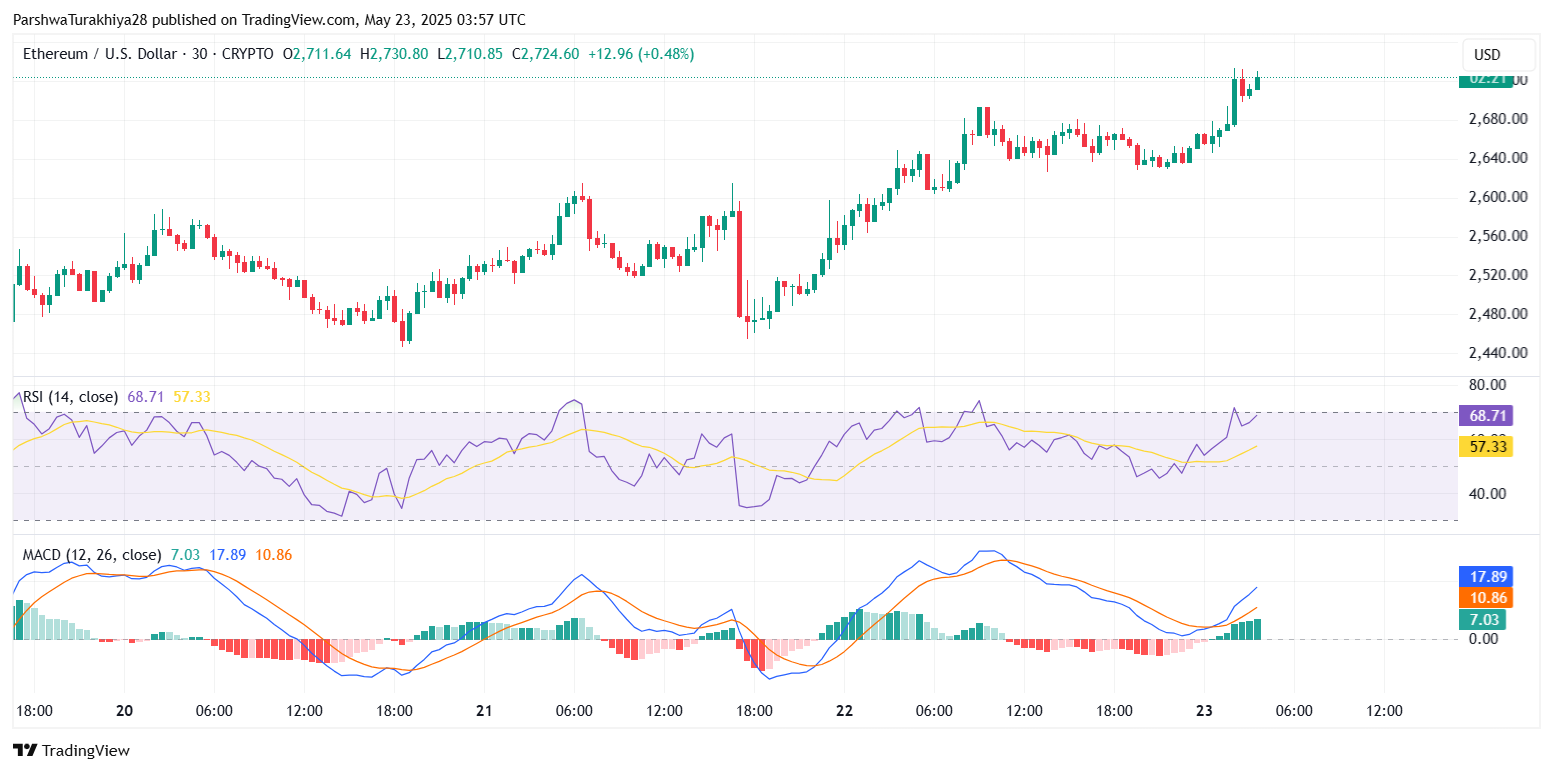
Looking at oscillators, the 30-minute RSI currently reads 68.71—just below the overbought 70 threshold—indicating the rally still has room to run but may face slowing momentum above $2,740. More importantly, the MACD has flipped positive with a bullish crossover, and histogram bars are accelerating to the upside, confirming upside momentum.
However, Stoch RSI on the 30-minute chart is cooling from its previous peak, hinting at a brief pause or pullback if immediate resistances reject price. Similarly, the Chande Momentum Oscillator sits at 58.93, indicating strength but not without risk of reversal if sentiment cools.
Why Ethereum Price Going Up Today
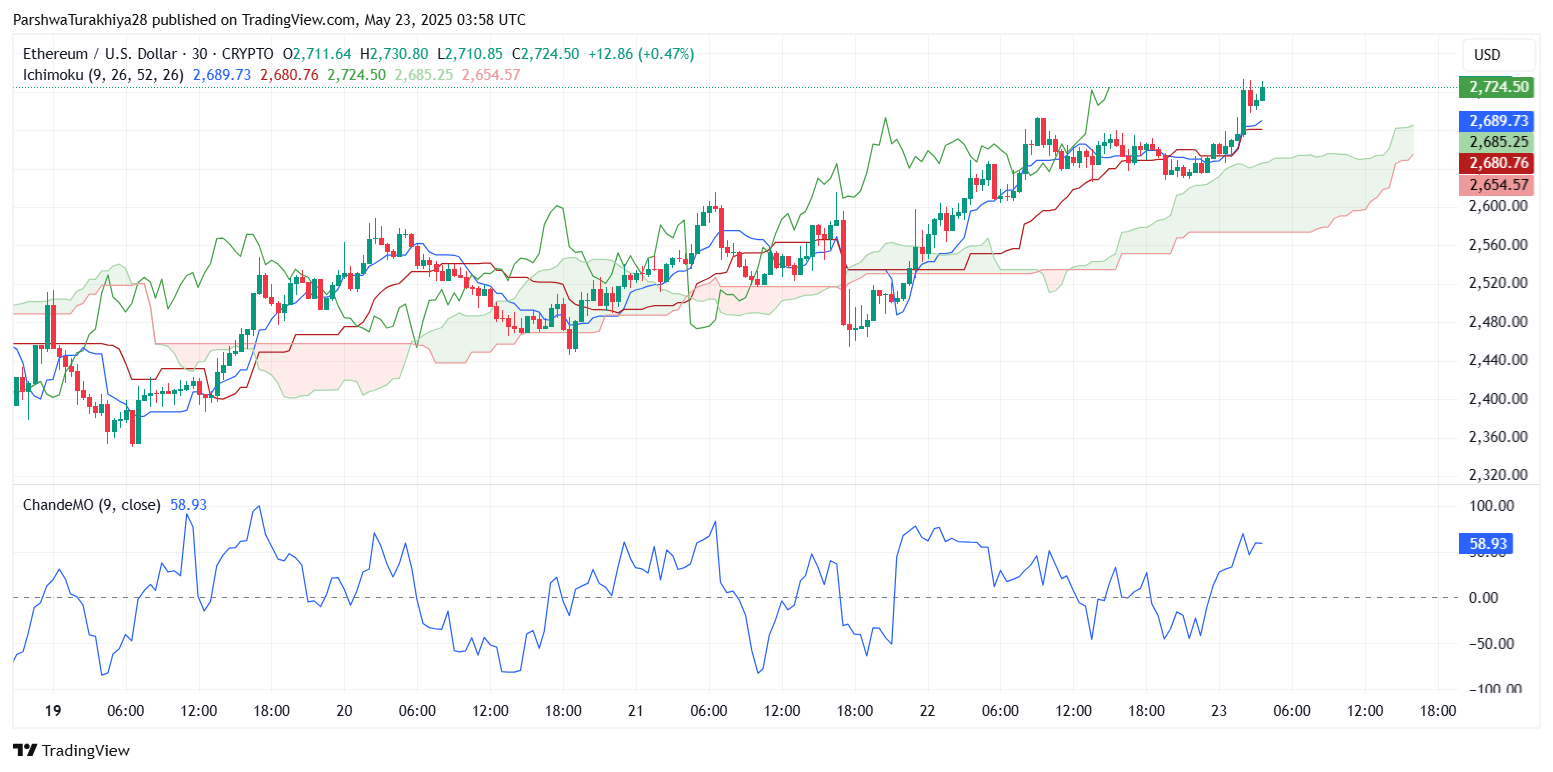
The question on traders minds is: Why is the Ethereum price going up today despite broader crypto market indecision? The answer lies in the breakout above the long-standing descending trendline that capped ETH since March. The recent surge above $2,685 coincided with a spike in trading volume and a clean break above the Ichimoku cloud, a sign of trend reversal on higher timeframes. This bullish structure is supported by the 4-hour Ichimoku span twist and a thick Kumo cloud providing future support—both of which signal that ETH’s bullish path may have legs toward the $2,800–$2,900 zone.
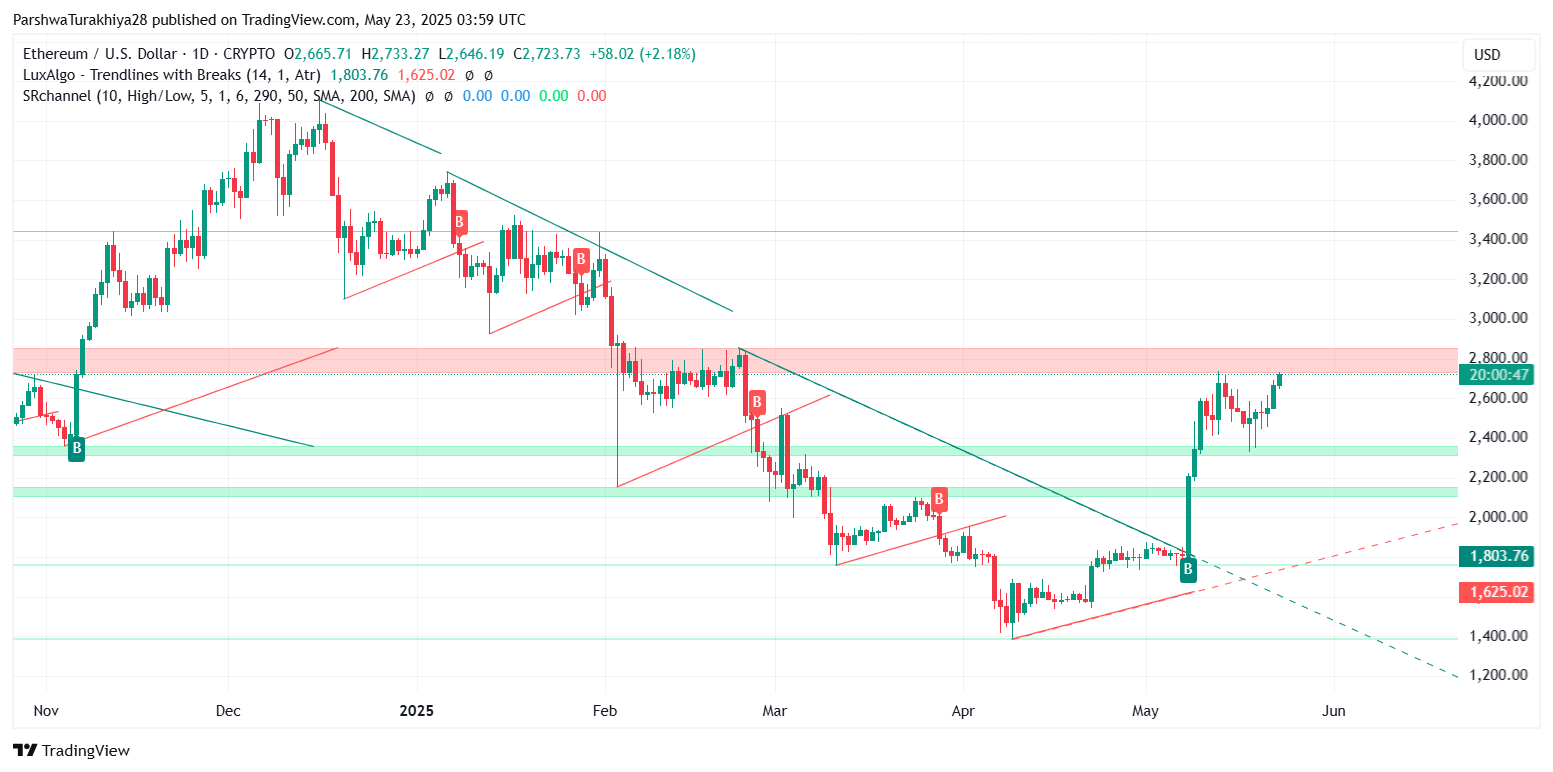
On the daily chart, Ethereum has now printed a clean breakout above the red resistance block between $2,600 and $2,730. This zone previously acted as a cap in March and April, and the breakout suggests buyers are eyeing a move toward the next resistance near $2,980 and possibly the 0.618 weekly Fib level at $3,159.
Key Levels to Watch and Price Forecast
From a chart perspective, the current structure remains bullish, but traders should be aware of potential overhead supply zones. Immediate resistance is now at $2,745 (Fib 0.0 level), followed by $2,800 and $2,980. If bulls maintain momentum and break these levels with volume, a fast move to $3,100 is not off the table.
On the downside, the first line of defense lies at $2,685 (Ichimoku Tenkan-sen), followed by $2,654 and $2,592 (20-EMA). A break below these levels could expose Ethereum to a retest of the $2,530–$2,444 demand band.
Short-Term Ethereum Price Forecast
The Ethereum price update shows that ETH remains bullish above $2,700 as momentum indicators point to a potential test of $2,800 or higher. However, traders should watch for overbought signals near resistance zones. If bulls can clear $2,745 with volume, Ethereum could enter a steeper climb. Otherwise, a short-term cool-off may precede the next leg higher.
Disclaimer: The information presented in this article is for informational and educational purposes only. The article does not constitute financial advice or advice of any kind. Coin Edition is not responsible for any losses incurred as a result of the utilization of content, products, or services mentioned. Readers are advised to exercise caution before taking any action related to the company.


Leave a Reply