
Bitcoin is trading at $106,724, reflecting a resilient uptrend amid considerable intraday volatility. With a market capitalization of $2.117 trillion and a 24-hour trading volume of $37.43 billion, bitcoin fluctuated within a tight range between $104,386 and $108,035.
Bitcoin
In the daily timeframe, bitcoin continues to uphold a strong bullish structure, having rallied from approximately $83,100 to a recent high of $108,035. Price action shows tight consolidation just below resistance at $108,500, suggesting potential accumulation. The relative strength index (RSI) at 71 and the Stochastic at 91 signal overbought conditions, urging caution among momentum traders. However, with exponential moving averages (EMA) and simple moving averages (SMA) across all short- to long-term durations—from the 10-period to the 200-period—indicating positive sentiment, the underlying trend remains firmly bullish.
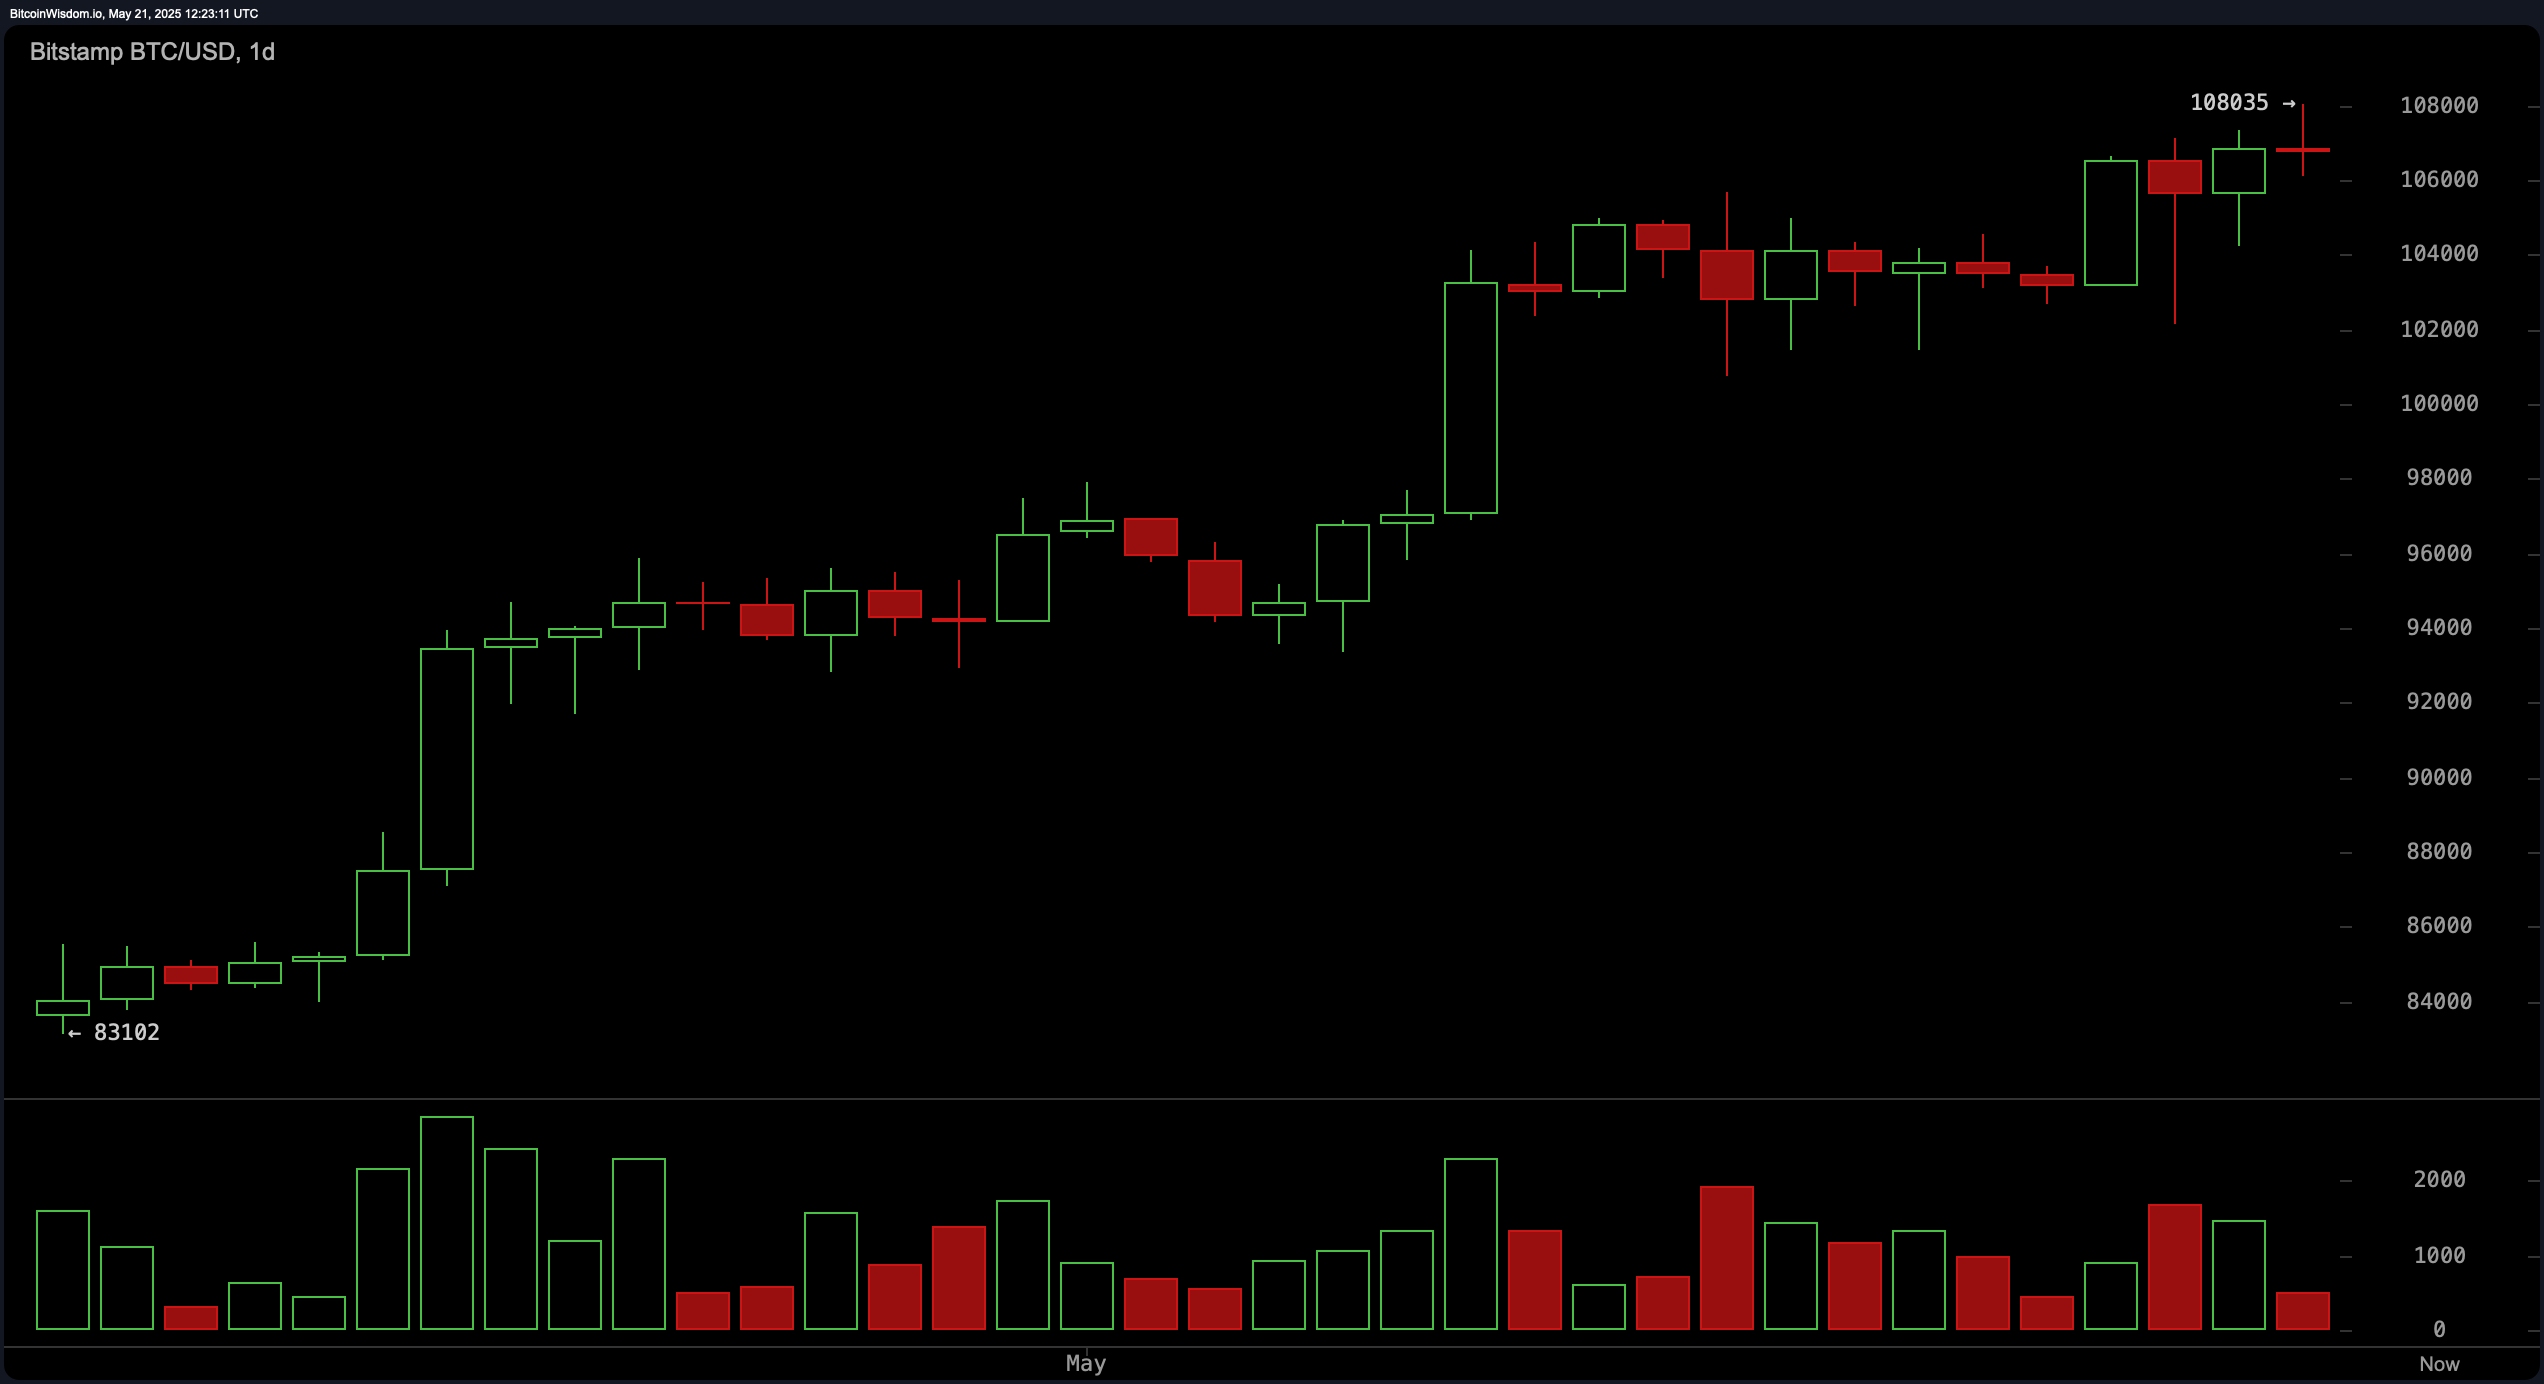
Bitcoin daily chart via Bitstamp on May 21, 2025.
The 4-hour chart reflects heightened intraday volatility, marked by a recent dip to $102,126 and a rapid rebound to $108,035. Currently, bitcoin is forming a consolidation base between $106,500 and $107,000, where strong buying interest is reemerging. Momentum oscillators reveal a mixed sentiment: while the momentum indicator supports buying with a value of 2,622, the moving average convergence divergence (MACD) signals selling with a value of 3,725.
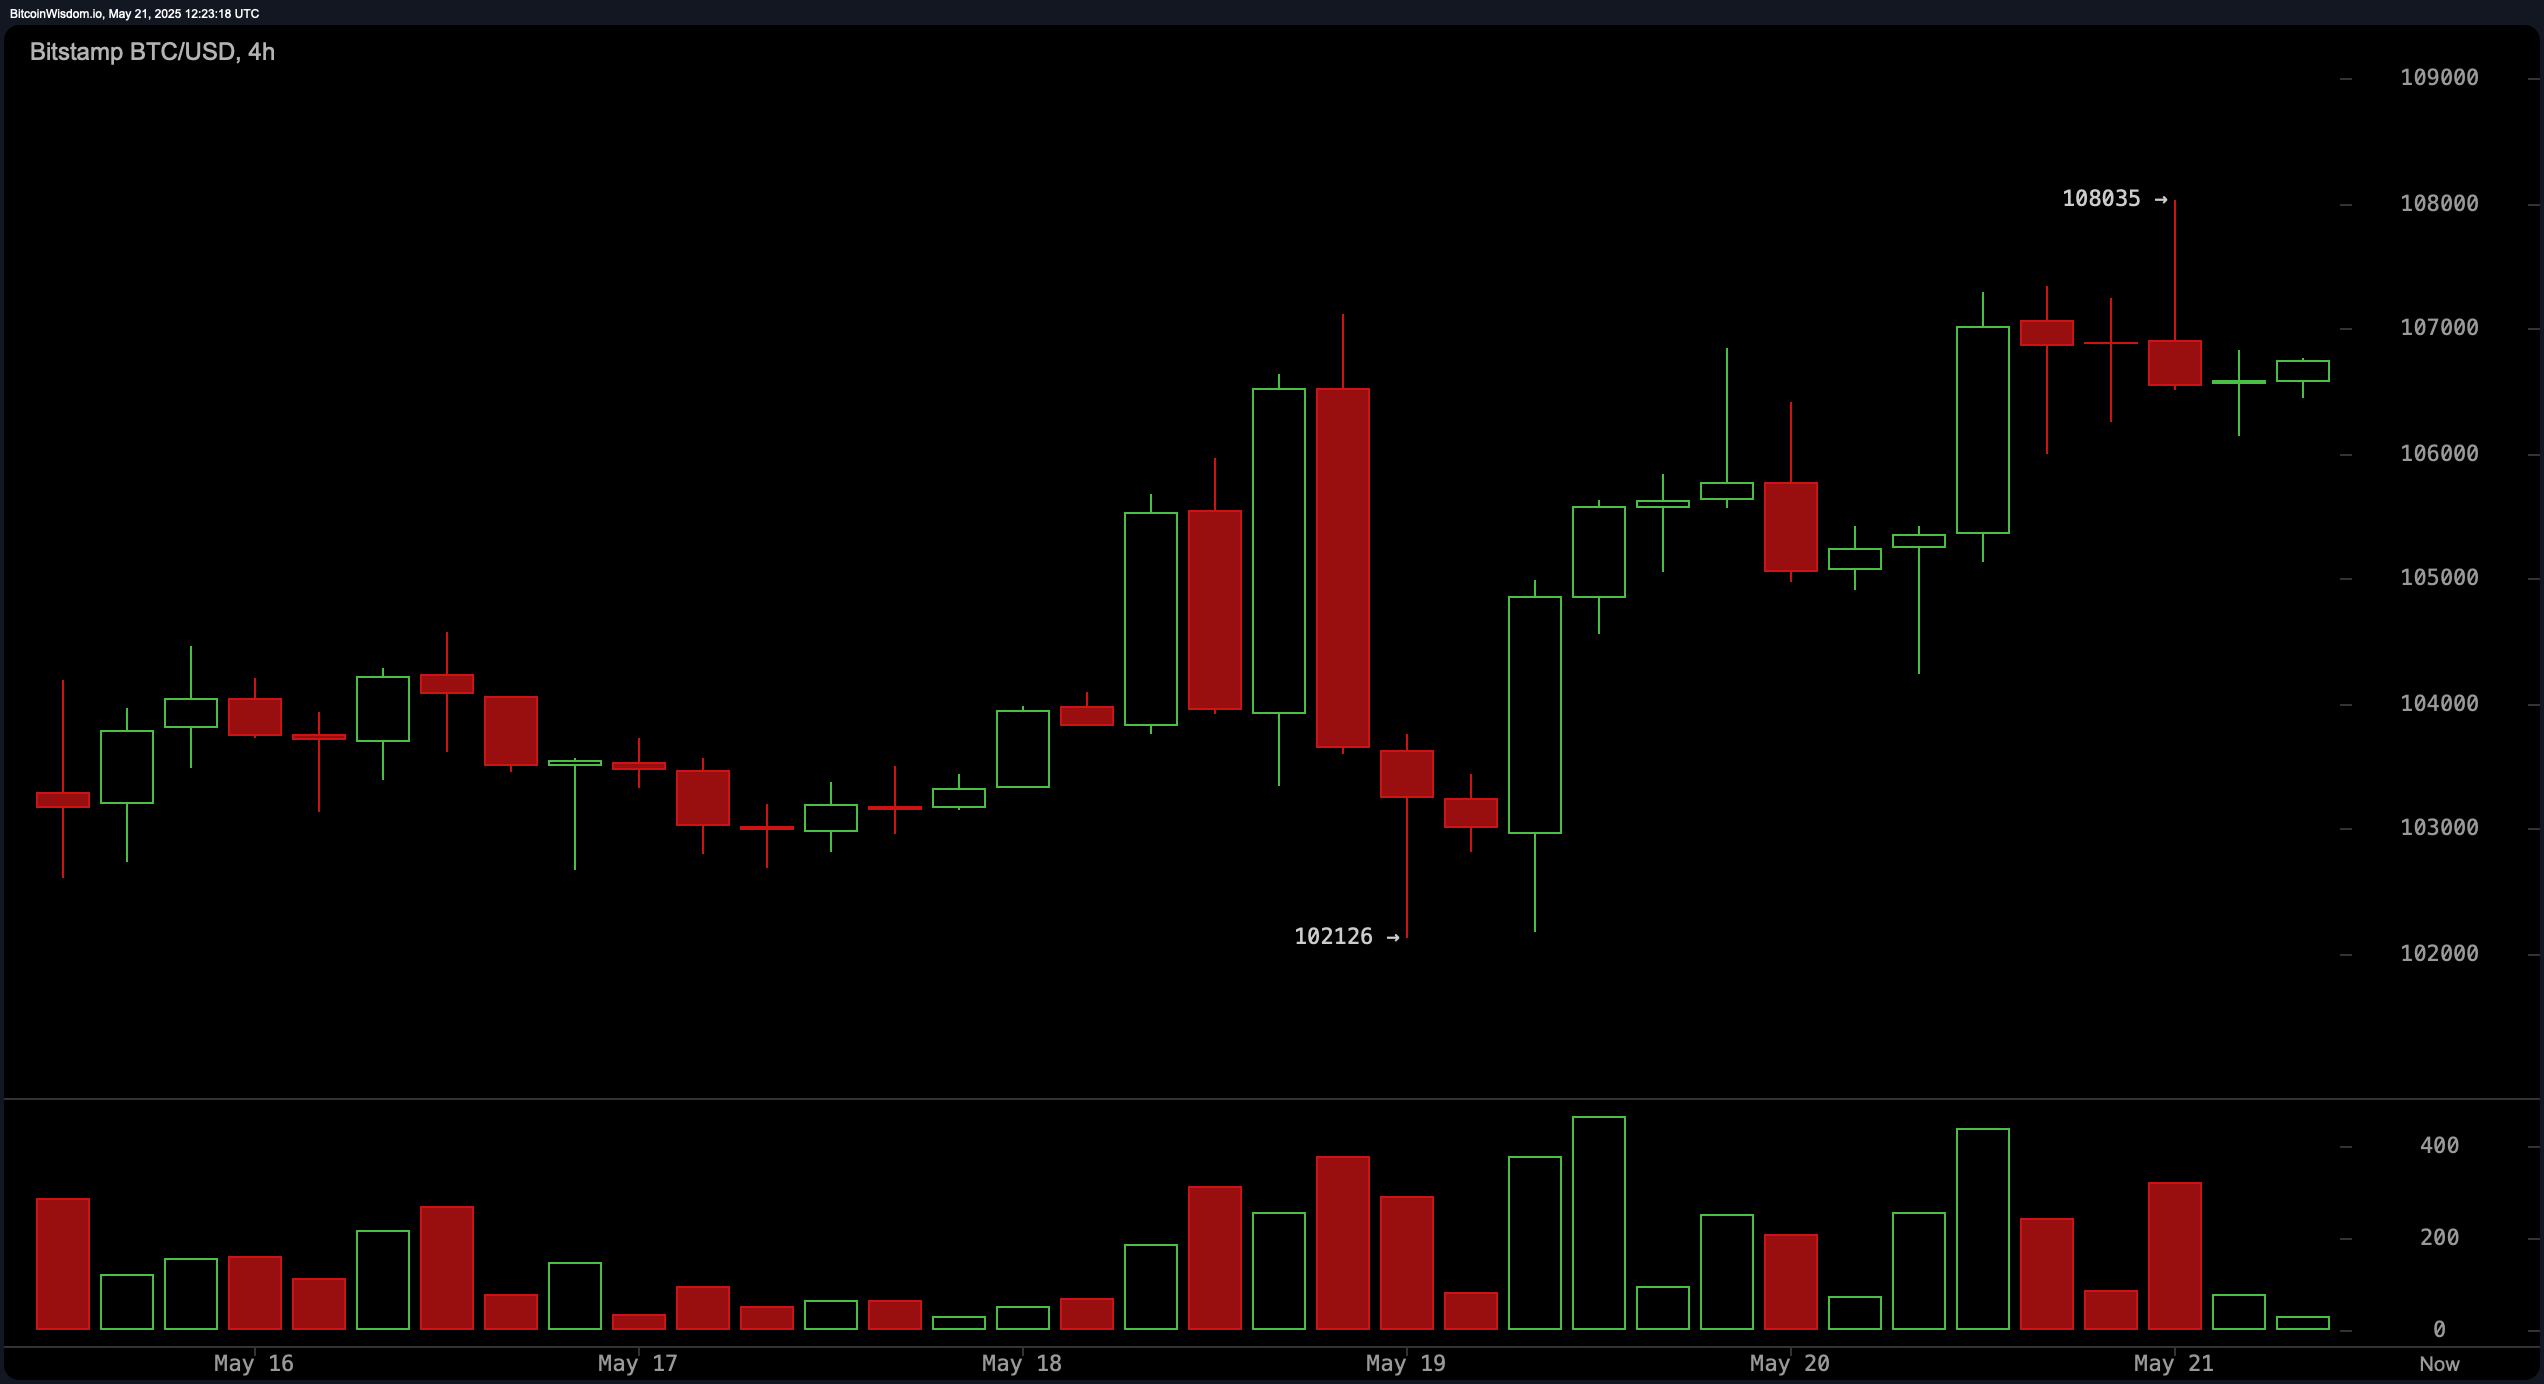
Bitcoin four-hour chart via Bitstamp on May 21, 2025.
On the 1-hour chart, the market displayed a rejection at $108,035 followed by a pullback to approximately $106,300, where a minor recovery appears underway. The intraday support range lies between $106,300 and $106,500, with resistance clustered from $107,500 to $108,000. Oscillators remain neutral to bearish in this timeframe, further reinforcing the cautious approach for scalpers and day traders.
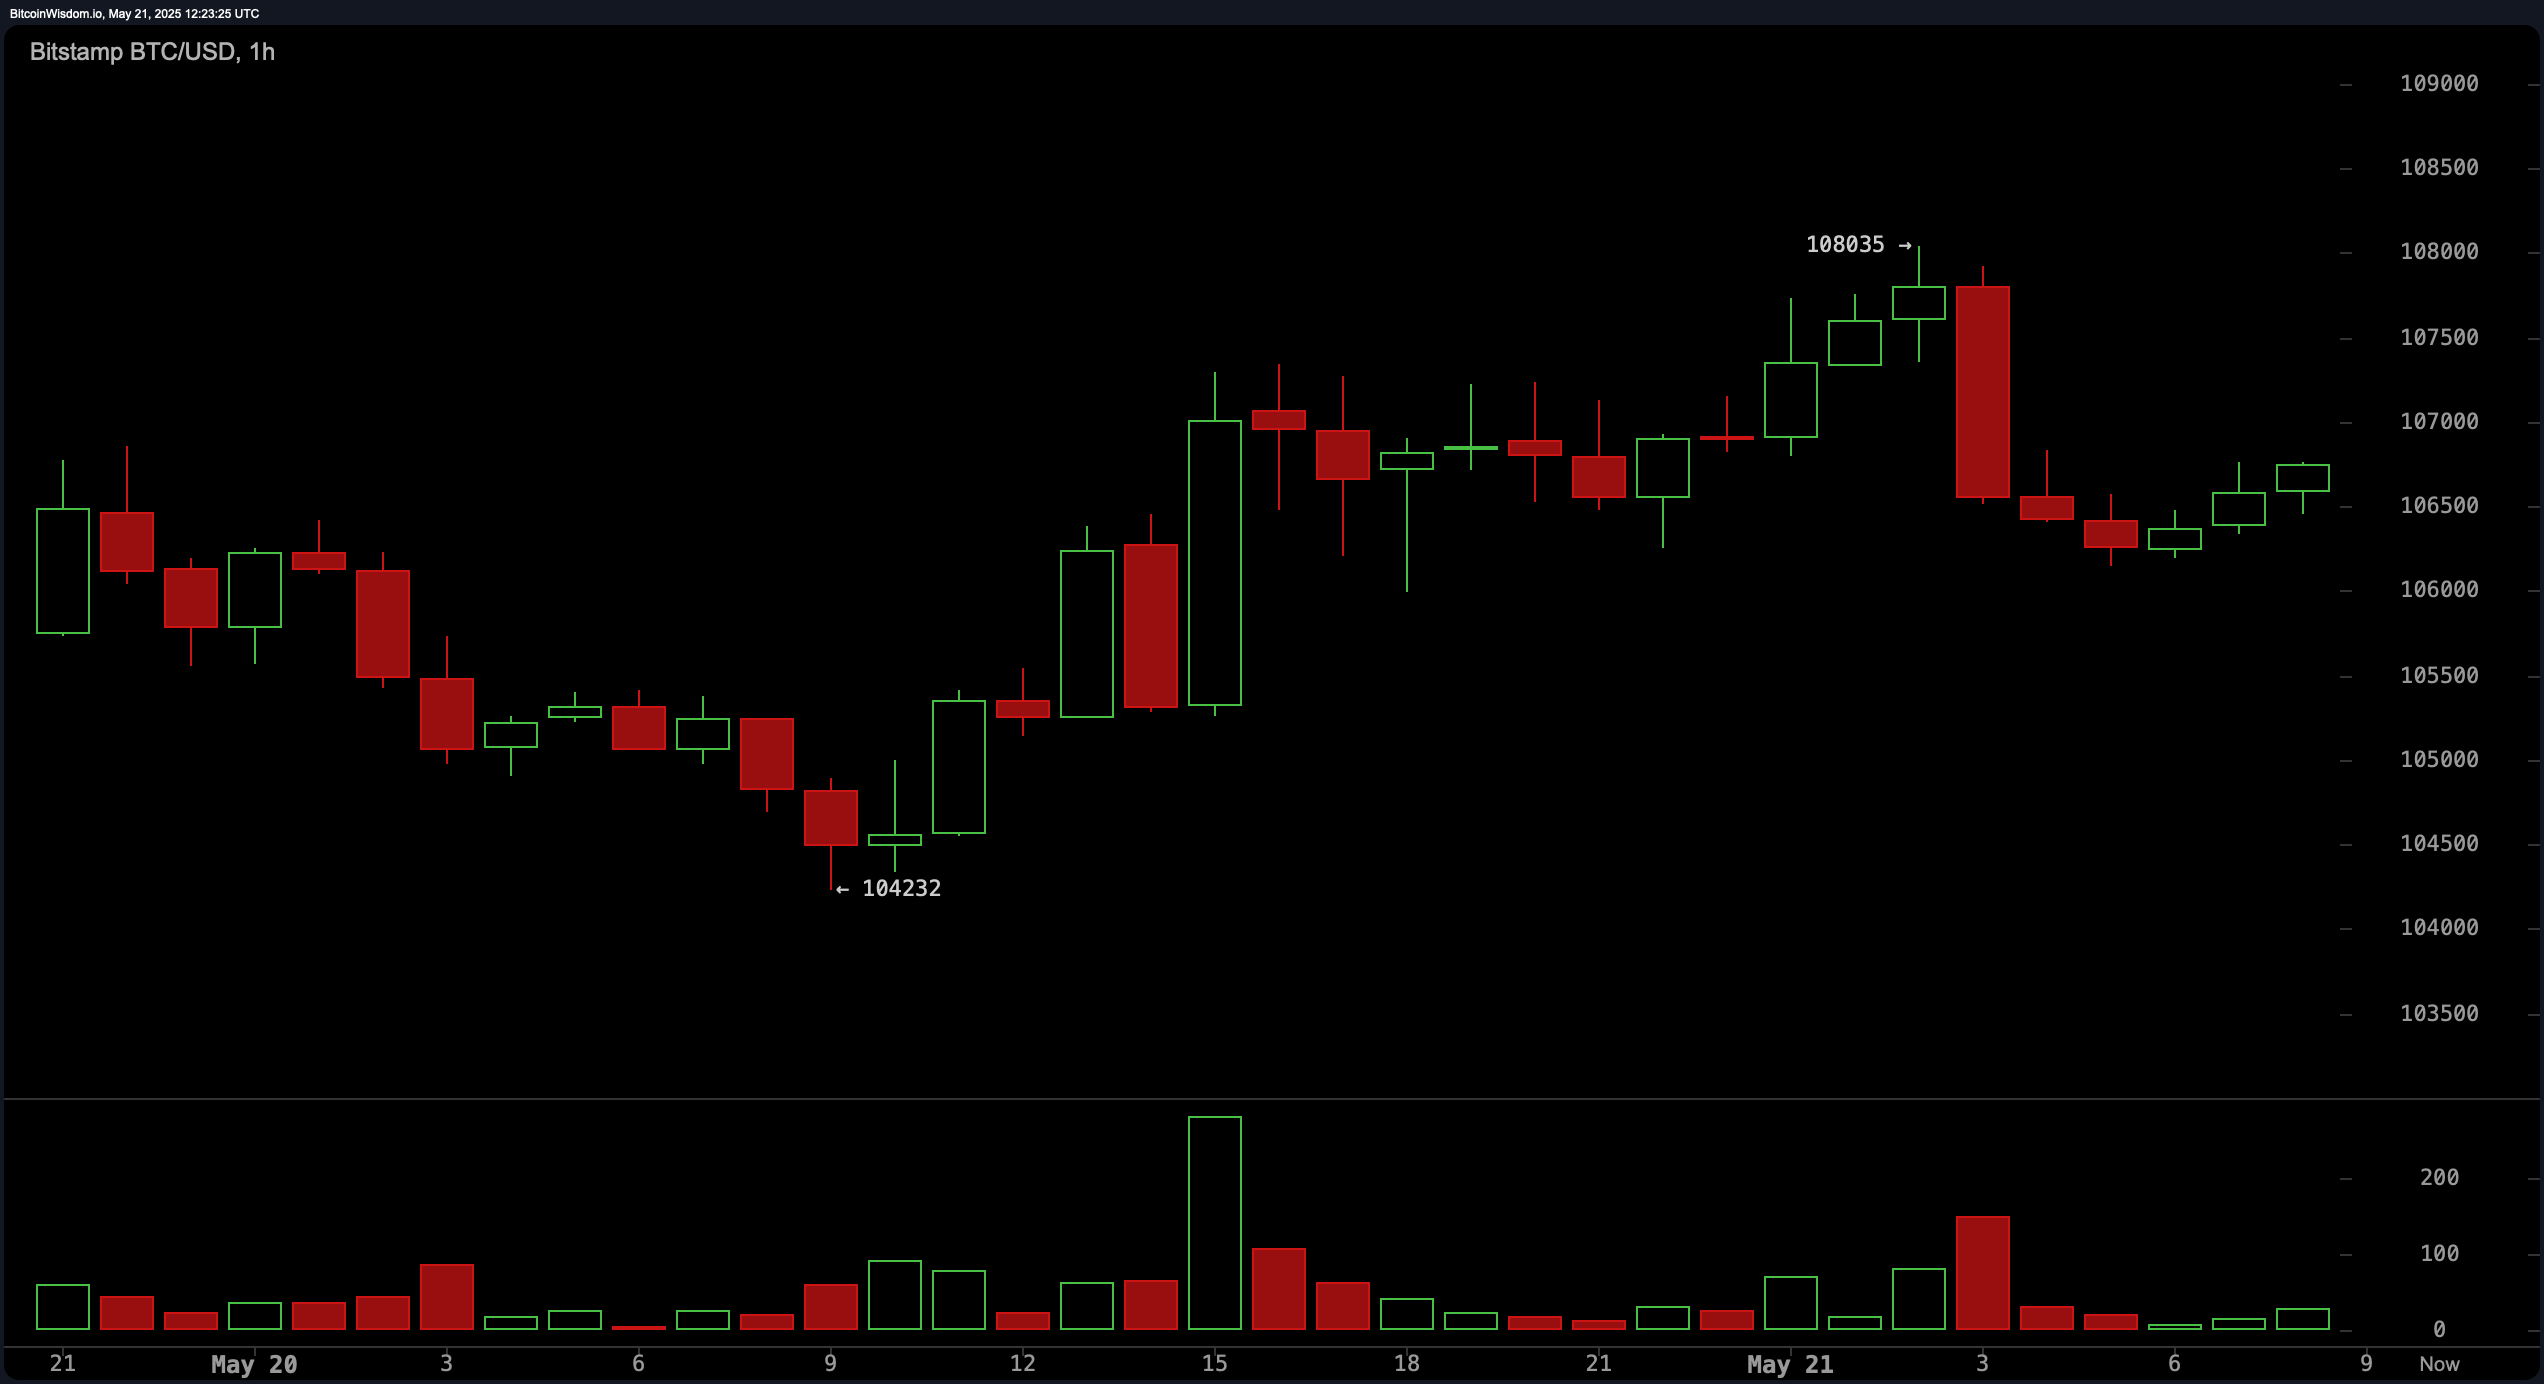
Bitcoin one-hour chart via Bitstamp on May 21, 2025.
The combination of technical indicators and price structure across timeframes confirms that bitcoin is in a macro bullish phase, though currently facing short-term resistance. Most moving averages—from 10-period to 200-period—advocate for continued accumulation, bolstering the broader trend. However, oscillators like the RSI and Stochastic flashing bearish alerts point to an overheated market, especially in the short term. This discrepancy between trend-following and momentum indicators suggests a potential consolidation or minor retracement before the next leg higher. Volume analysis also supports this outlook, with strong demand returning on dips and sellers stepping in near resistance.
In summary, while bitcoin maintains upward momentum supported by favorable moving averages, near-term price action demands careful trade management. Traders should watch for a decisive move above $108,500 or a confirmed support retest around $104,000 for reliable entries. Oscillator divergences and tight consolidation range suggest increased volatility and the need for disciplined stop-loss strategies. With institutional and retail interest sustaining high volume levels, bitcoin remains technically strong but not without short-term risk signals.
Bull Verdict:
Bitcoin remains structurally bullish across all major timeframes, supported by a unanimous buy signal across exponential and simple moving averages from the 10-period to the 200-period. If buyers manage a breakout above the $108,500 resistance with sustained volume, the uptrend is likely to accelerate, opening the path to new all-time highs.
Bear Verdict:
Despite the prevailing uptrend, overbought signals from the relative strength index and Stochastic highlight growing downside risk. If bitcoin fails to hold above $105,500 and breaks below the $104,000 support zone, the market could shift toward a deeper retracement, invalidating the bullish structure in the short term.


Leave a Reply