
Ethereum price today is trading around $2,495, reflecting a steady decline from the recent high of $2,737 posted earlier this week. Despite a powerful breakout from the $1,800 zone that triggered one of the strongest Ethereum price spikes of the quarter, upside momentum is showing early signs of exhaustion near the key resistance band around $2,600–$2,750. The 38.2% Fibonacci retracement on the weekly chart has now turned into a battleground.
What’s Happening With Ethereum’s Price?
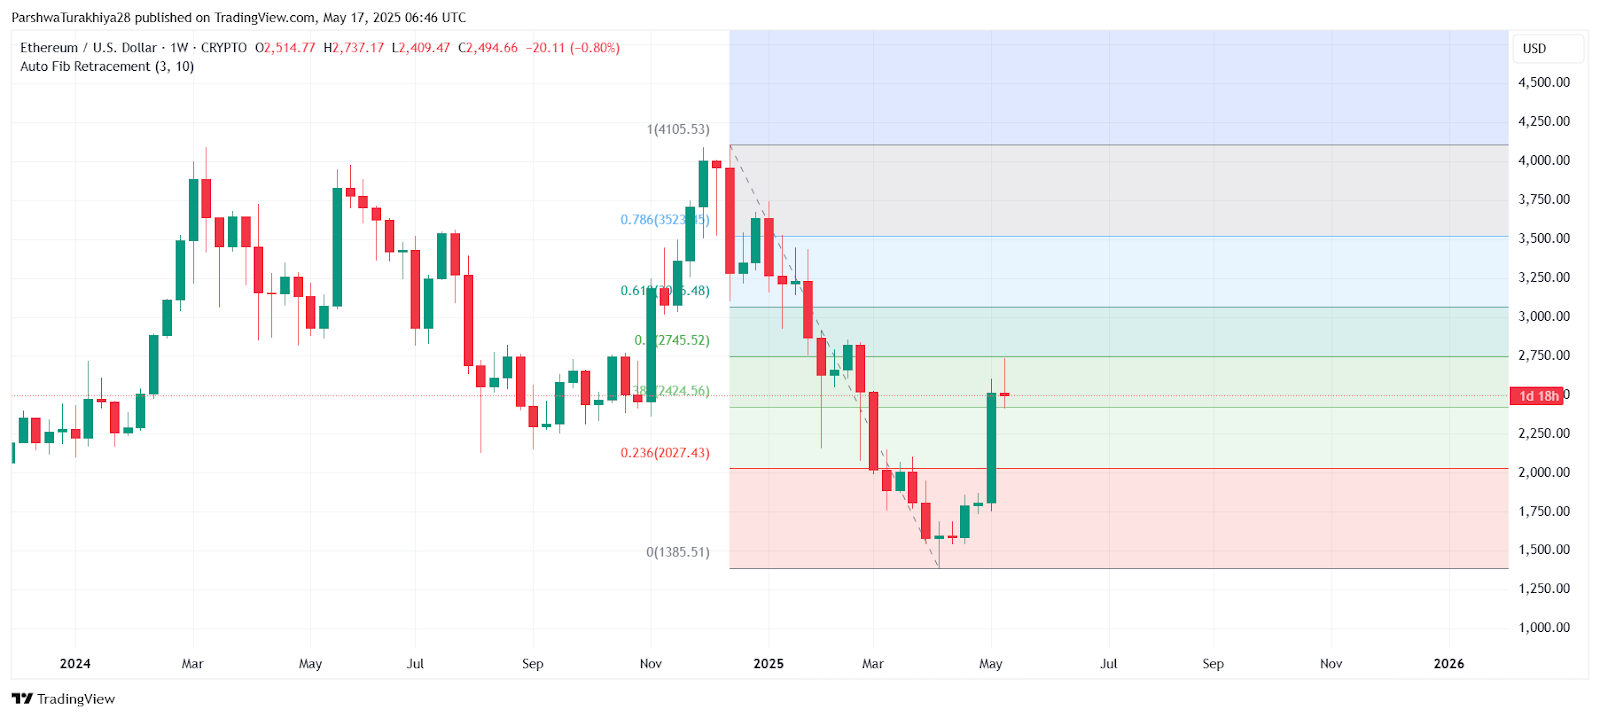
ETHUSD price dynamics (Source: TradingView)
On the weekly chart, Ethereum price action is facing supply pressure after reclaiming the 0.236 Fib level at $2,027 and tapping the 0.382 level at $2,424. This area around $2,400–$2,500 coincides with heavy prior consolidation seen in 2023, making it a crucial pivot for bulls. The current candle shows a long upper wick and a small body, indicating hesitation at this resistance.
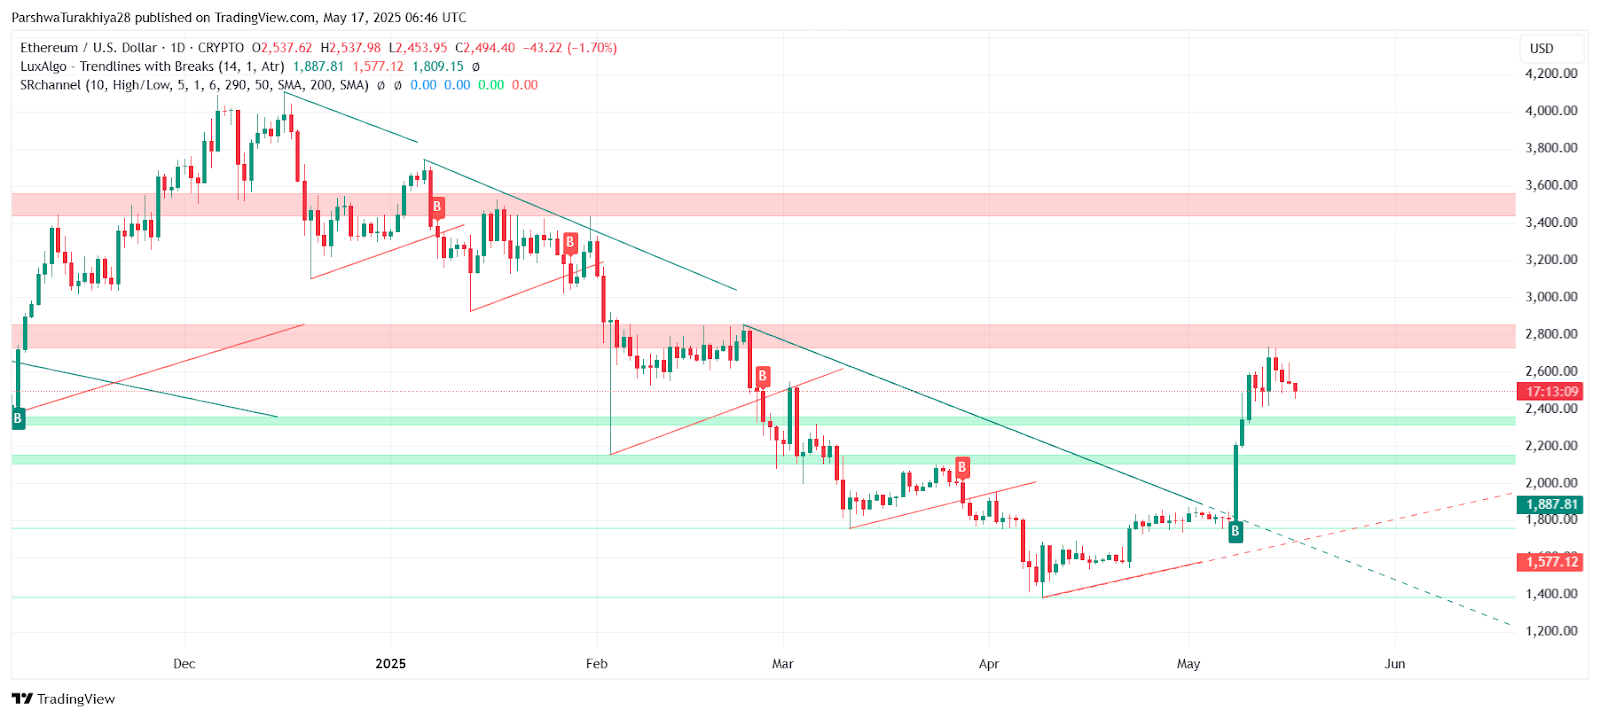
ETHUSD price dynamics (Source: TradingView)
Zooming into the daily chart, the recent breakout above the descending trendline has lost momentum just ahead of the next major red zone near $2,745 (Fib 0.5 level). This matches with rejection candles on May 14–15, where ETH failed to hold above $2,600 and slipped back into consolidation territory.
Momentum Weakens Across Intraday Timeframes
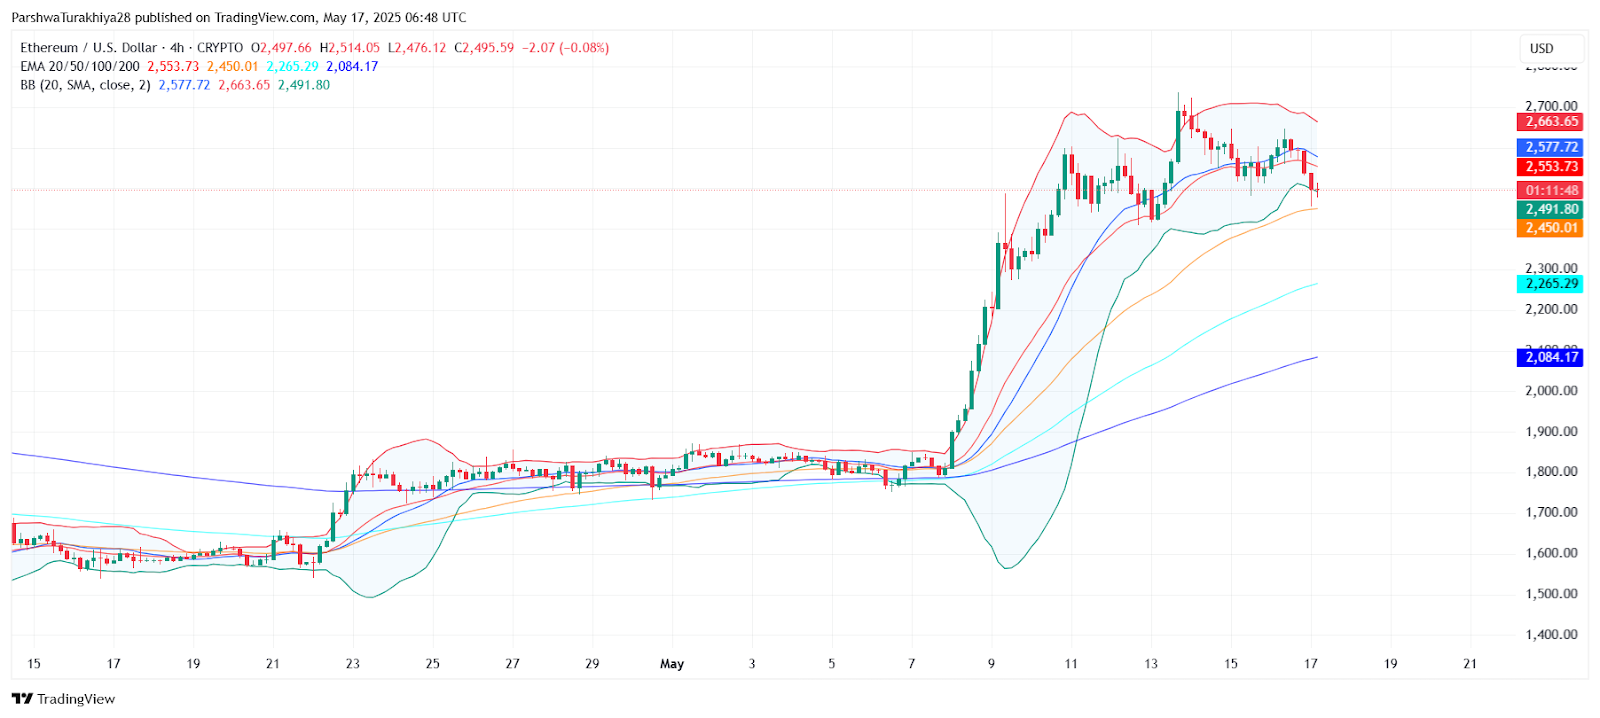
ETHUSD price dynamics (Source: TradingView)
On the 4-hour chart, ETH is forming a descending triangle pattern after the vertical rally. Price has dropped below the 20-EMA ($2,553) and is now hovering just above the 50-EMA ($2,450), which serves as near-term support. The Bollinger Bands are starting to compress, with ETH trading at $2,491.80 — suggesting volatility is likely to re-expand soon.

ETHUSD price dynamics (Source: TradingView)
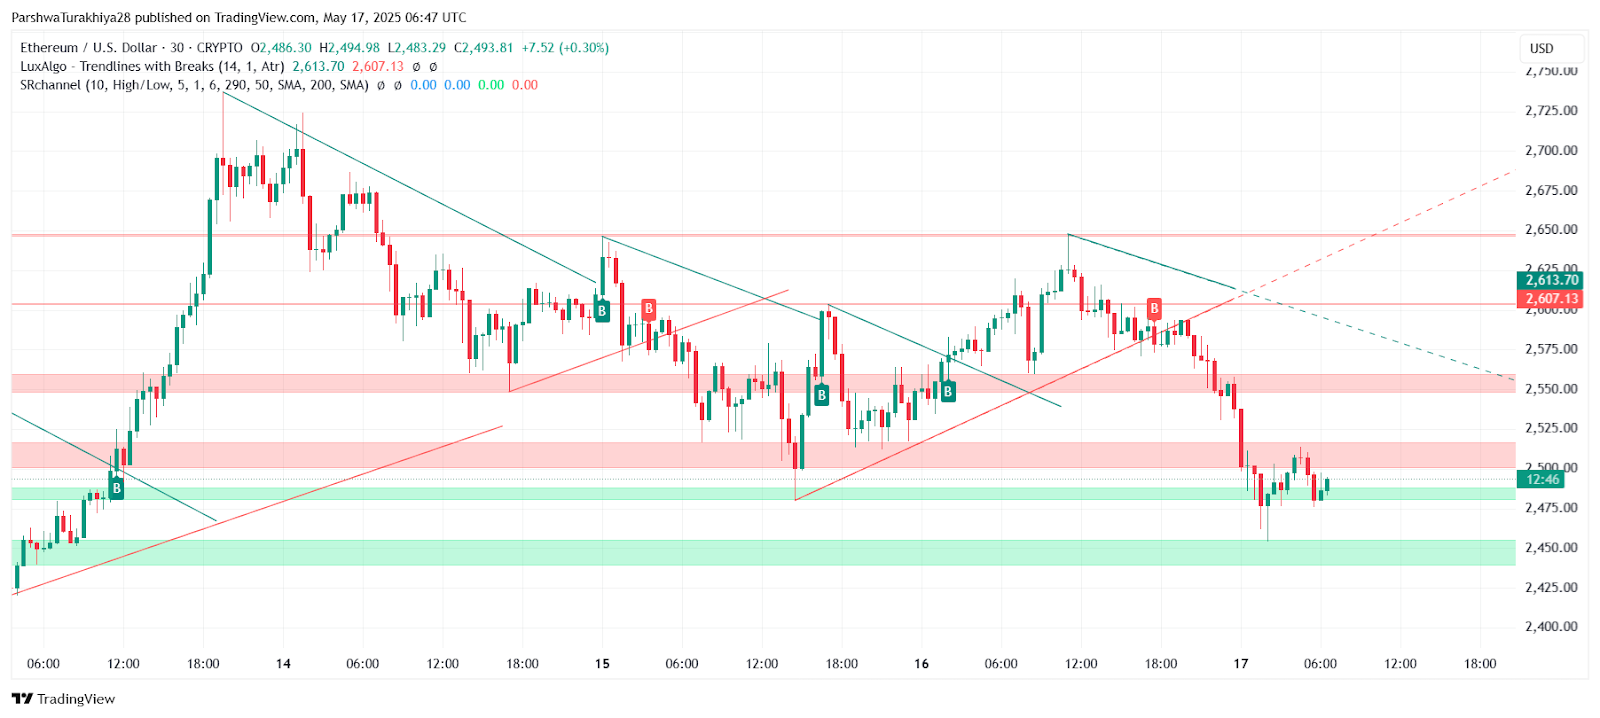
On the 30-minute chart, RSI remains weak at 37.96, while MACD is still in bearish territory. The histogram is flat, and crossover signals are inconclusive, showing no strong buy signals yet. This paints a cautious near-term picture for traders expecting a swift recovery.
Why Ethereum Price Going Down Today?
The weakness in Ethereum price today can be attributed to three key factors: rejection from a major Fibonacci cluster, declining intraday momentum, and a breakdown in short-term trendline structure. After a parabolic run-up from sub-$2,000 levels, the current consolidation suggests profit-taking by short-term holders.
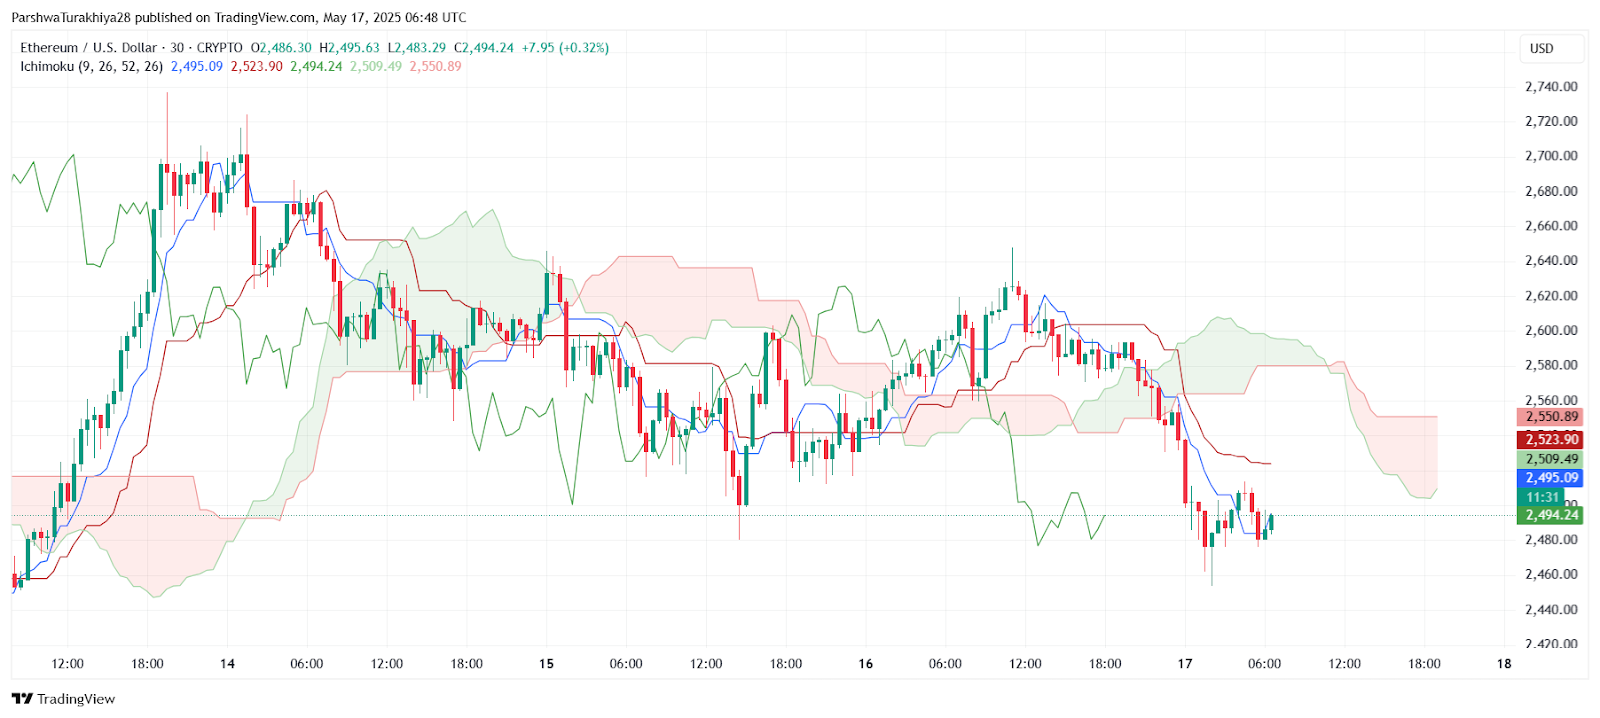
ETHUSD price dynamics (Source: TradingView)
Moreover, the Ichimoku Cloud on the 30-minute chart shows price stuck below the cloud base and Tenkan-Sen — a bearish configuration signaling that trend control remains with the sellers for now. Until ETH closes decisively above $2,525–$2,550, upside potential remains capped.
Short-Term Outlook: Will $2,450 Support Hold?
ETHUSD price dynamics (Source: TradingView)
Looking ahead, ETH must hold the $2,450–$2,470 demand zone to avoid deeper correction toward the $2,300 and $2,265 levels, which align with the 100-EMA and previous breakout base. If this zone breaks down, a return to the $2,100–$2,000 band becomes likely.
However, a reclaim of $2,525 with bullish RSI crossover and MACD confirmation could open the gates to $2,600 and eventually $2,745. The broader trend remains constructive, but the market needs fresh momentum to retest recent highs.
Ethereum Price Forecast Table
Disclaimer: The information presented in this article is for informational and educational purposes only. The article does not constitute financial advice or advice of any kind. Coin Edition is not responsible for any losses incurred as a result of the utilization of content, products, or services mentioned. Readers are advised to exercise caution before taking any action related to the company.


Leave a Reply