
Sui (SUI) is showing renewed bullish momentum after breaking above key resistance levels, and its technical indicators are pointing toward a potential continuation rally. The charts reveal a well-structured uptrend forming on both the daily and hourly timeframes, which has investors eyeing the next major psychological barrier at $5.
SUI Price Prediction: What Does the Daily Chart Say?
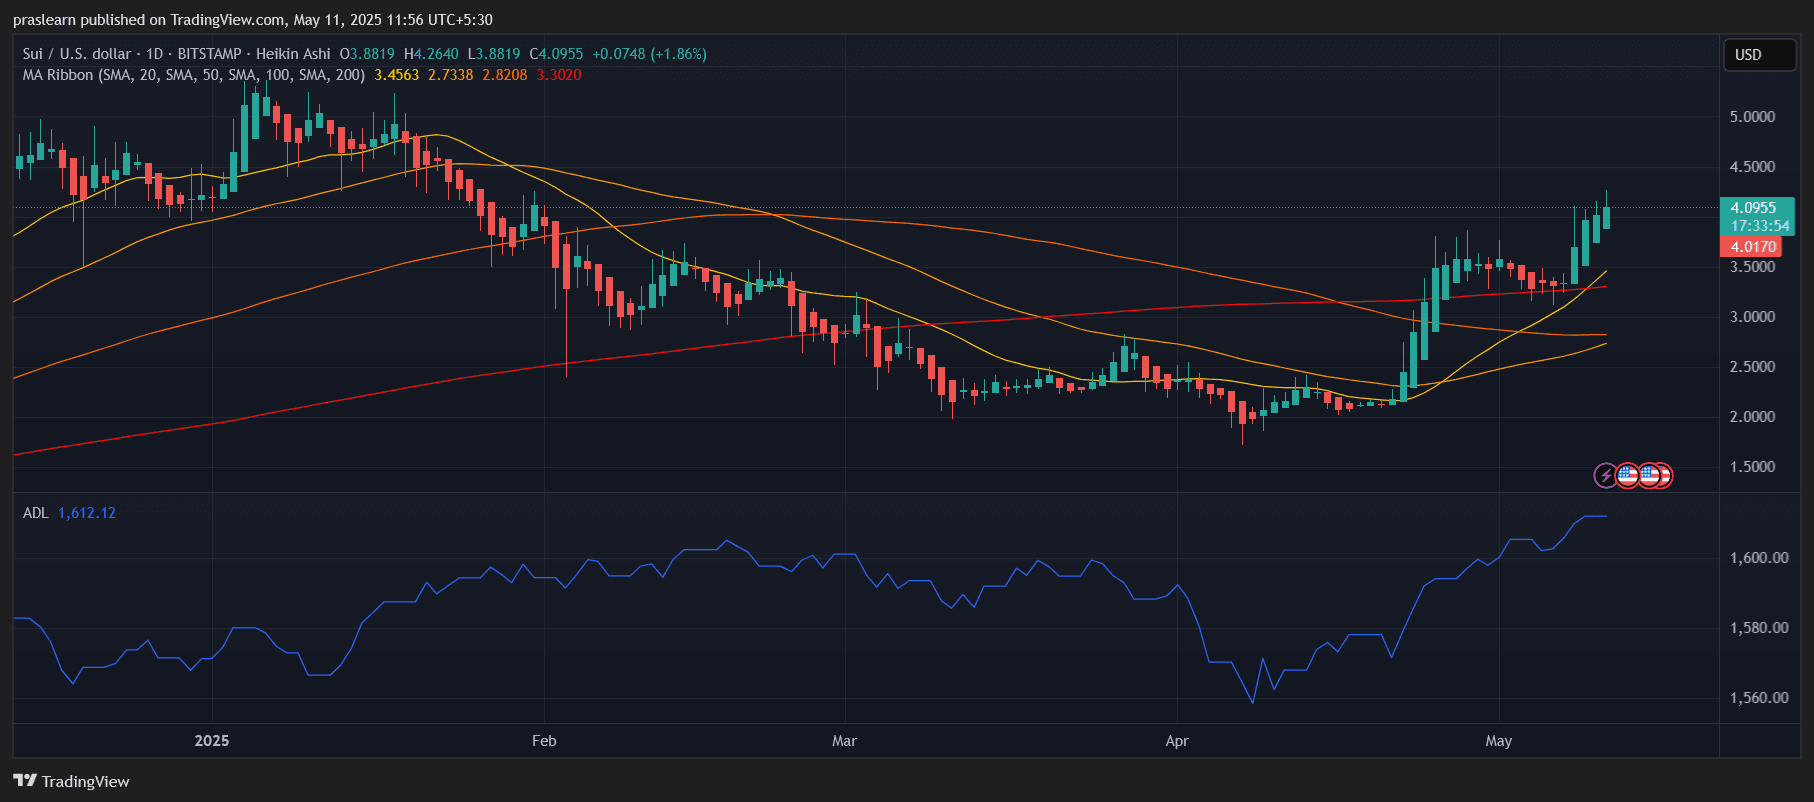
SUI/USD 1 Day Chart- TradingView
The daily chart displays a strong bullish recovery from April lows near $1.80. After weeks of consolidation and sideways movement, SUI has finally broken above the 50-day and 100-day moving averages. It’s currently trading above all major SMAs (20, 50, 100, 200), with the 20-day SMA crossing above the 50-day — a textbook bullish crossover. The price is hovering around $4.09, up nearly 1.86% for the day, and has cleanly breached previous resistance near $3.50–$3.80.
What’s more interesting is the positive slope in the Accumulation/Distribution Line (ADL), indicating growing buying pressure. The recent SUI price surge is not just speculative — it’s supported by strong volume and accumulation, which adds weight to the breakout.
What’s Happening on the Hourly Chart?
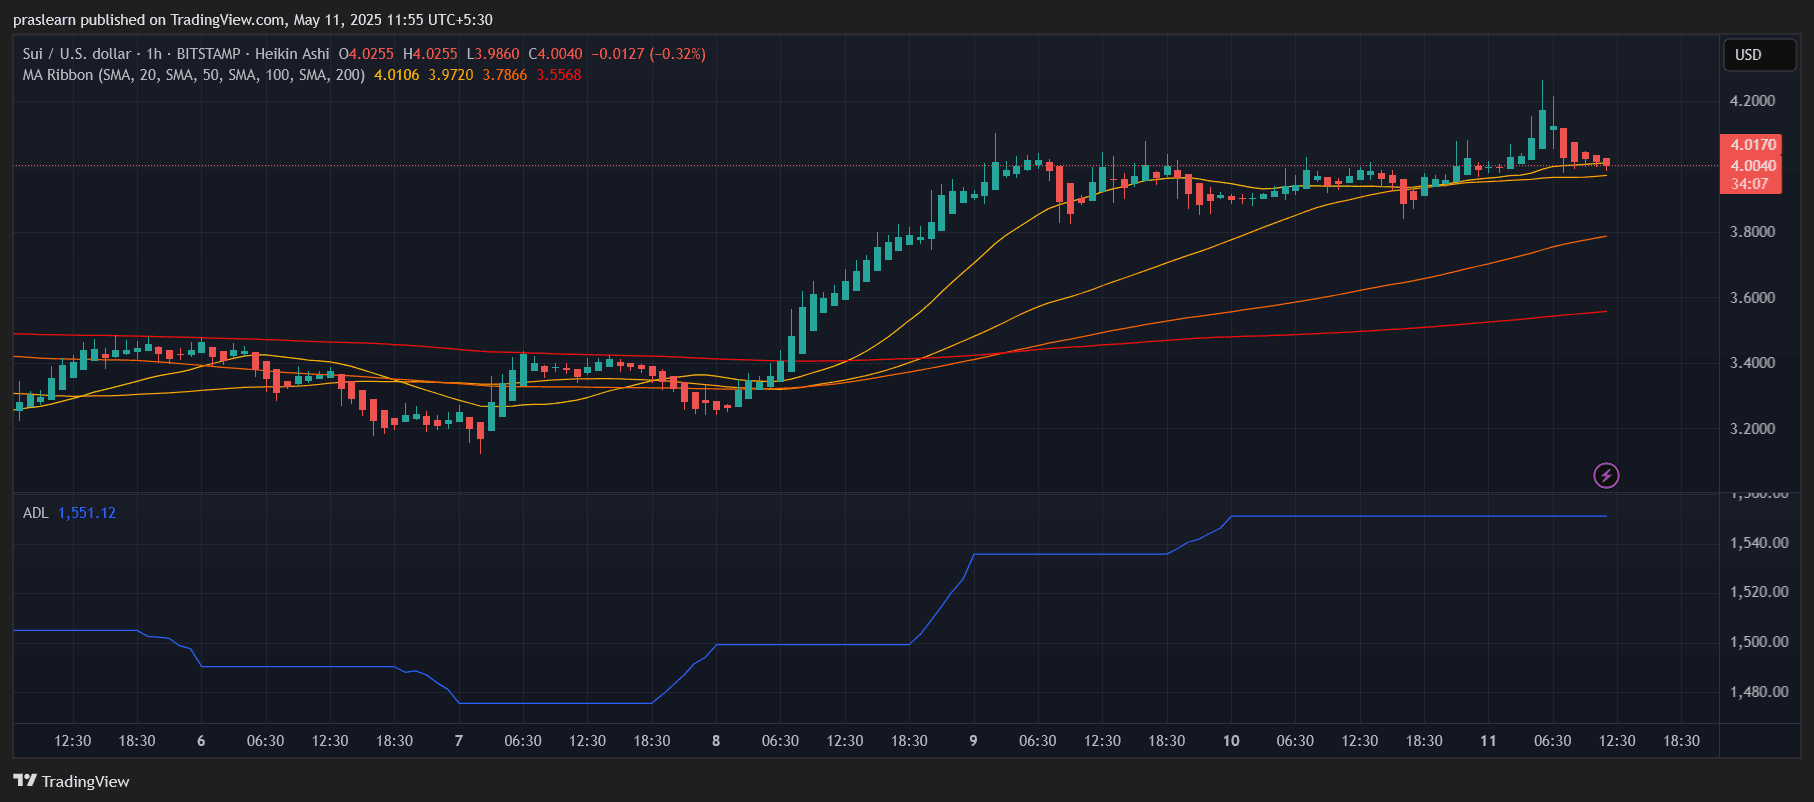
SUI/USD 1 Hr Chart- TradingView
Zooming into the hourly chart, the momentum looks just as solid. After retesting the $3.80 zone multiple times, SUI price launched a strong rally, hitting an intraday high above $4.20 before pulling back slightly. The moving averages are perfectly aligned for a short-term rally: the 20, 50, 100, and 200 SMAs are stacked bullishly. Despite a minor cooldown at press time, SUI is still trading above the 20-SMA on the 1-hour chart — signaling a healthy trend.
Volume spikes on upward candles and flat ADL during dips suggest that short-term dips are being bought aggressively. This setup increases the likelihood of another leg up if SUI holds above $3.95.
SUI Price Prediction: Will SUI Hit $5 Soon?
Given the technical structure and current momentum, $5 is the next logical resistance target. The psychological round number, combined with the high from early January, makes it an attractive level for both swing traders and profit-bookers. If the bulls maintain control and SUI price stays above $4.00, we could see an impulsive move toward $4.60 first, followed by a potential breakout to $5.
On the downside, $3.80 acts as a crucial support. A breakdown below this level could trigger a retest of the 50-day SMA near $3.30.
Final Thoughts
SUI price is no longer in accumulation — it’s in breakout mode. With strong support from moving averages, increasing accumulation, and positive short-term structure, the momentum favors bulls. If macro market conditions stay neutral to positive, SUI could very well test the $5 mark in the coming days.


Leave a Reply