
Cardano (ADA) price gained attention from traders due to technical patterns that signal a potential strong surge. The formation indicated that a substantial price increase could occur if ADA breaks through decisive levels.
Cardano Price Holds Above $0.70 in Tight Weekly Range
Cardano price sustained a confined trading pattern throughout the past seven days by oscillating between $0.67 and $0.72.
The latest market update showed price token trading at $0.7082 while experiencing slightly positive price movement despite general market volatility.
In addition, the trading activity showed traders remain undecided about future market direction. ADA experienced an 8% increase in value during the past month. Yet, its weekly performance showed a decline exceeding 2%.
This stability above $0.70 suggested firm support from investors, particularly around the $0.65 zone. It was a critical level during previous retracements.
Bullish Flag Pattern Points Toward Possible $1.33 Target
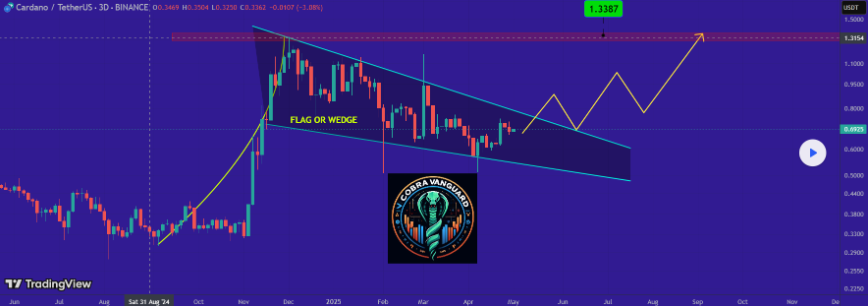
Meanwhile, analyst CobraVanguard from TradingView presented a bullish continuation pattern that appeared on the 3-day ADA/USDT chart.
The technical pattern showed either a falling wedge or a flag structure that formed after ADA reached its peak above $1.30 in late 2024.
That upward move is referred to as the “flagpole” in chart pattern terminology.
Cardano Price Chart Source: TradingView
Notably, ADA price experienced a descending channel movement from January 2025 until now. It reached resistance points at $1.30 and $1.10, and $0.90. It maintained support near $0.63, $0.60, and $0.56.
The crypto price has not validated a breakout above the flag’s upper trendline. The analyst predicted that a successful breakout would push ADA towards $1.3387, representing an 89.18% increase from its present market price.
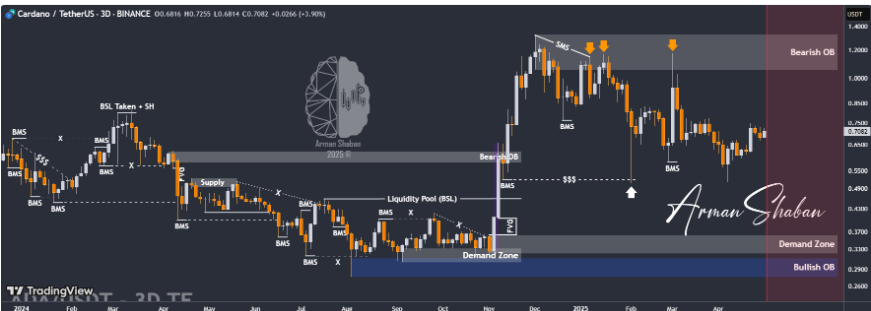
Moreover, in his analysis, Arman Shaban expanded this perspective through Smart Money Concepts. The analysis revealed that ADA price returned to a demand area near $0.50 after traders rejected it at a bearish order block.
The price found support at the bullish order block level. That triggered a price rebalancing mechanism that restored it above $0.70.
Cardano Price Chart Source: TradingView
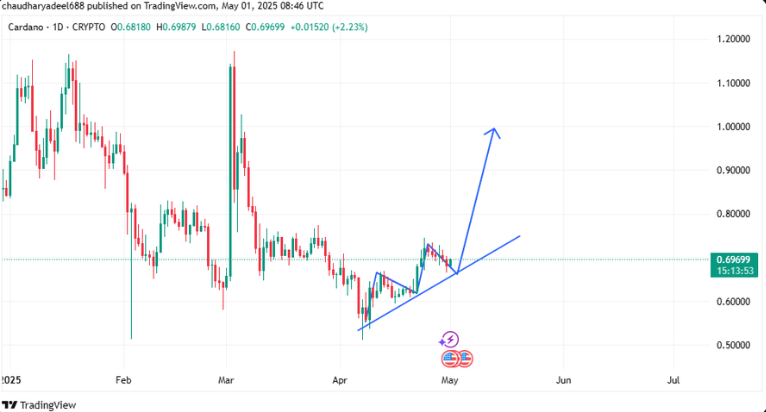
Another analysis from Token Talk suggested Cardano (ADA) could target $1 after holding support above $0.68. The chart showed a bullish ascending trendline, with a projected breakout pointing toward the $1.00 level.
Cardano Price Chart Source: X
Notably, the analyst indicated $0.73 as a key resistance. If ADA breaks above this, it could rally to $1.60 short term, with long-term projections reaching $10.
The price action at press time reflected growing momentum, supported by a clean uptrend pattern on the daily chart and increasing volume near breakout levels.
Derivatives Market Supports Long-Bias Sentiment
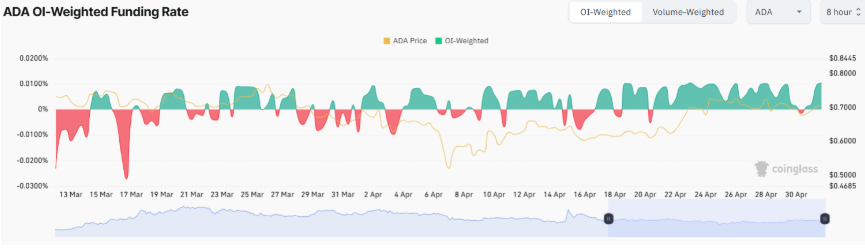
On the fundamental indicators, sentiment data from derivatives exchanges matched the information derived from technical analysis. CoinGlass data revealed the ADA OI-weighted funding rate maintained positive values from mid-April.
Long-position traders have continuously paid funding fees to short-position traders throughout this bullish market phase.
Cardano Derivatives Data
In addition, Cardano price experienced a slow and steady price increase while maintaining a stable funding pattern from below $0.61 to its current value. The rise in perpetual futures trading and ongoing price movement demonstrated that more traders expect the altcoin to rise in value.
Furthermore, the increased Open Interest (OI) values demonstrated strong participation from traders who have taken leveraged long positions.
Supporting a bullish outlook, recent analysis from Justin Wu, CryptoPatel, and Javon Marks indicated Cardano price confirmed a breakout above a multi-month descending wedge. ADA rose over 12% weekly, forming higher highs and targeting $1.24 and $1.46 as key resistance levels.
Volume confirmation and rising channel support suggested continued upward momentum. The analysts projected possible moves toward $2.91 if ADA clears intermediate resistance zones backed by historical price behavior and Fibonacci models.


Leave a Reply