
After nearly five recent months of trading sideways and in a downward trendline, VeChain (VET) has officially breached a significant decreasing trendline. This is the breakout of a technical shift that could be the precursor of a long run to the upside.
After analyzing chart patterns and market structure, analysts affirmed that price momentum could still bring a 73% upside target.
VeCain Ends Consolidation Under Trendline with a Breakout
Looking at 8-hour VET/USDT charts, we see that VeChain has been confined within a descending channel since December 2024. Recently, VET has continuously tested the upper trendline but got rejected multiple times until late April 2025.
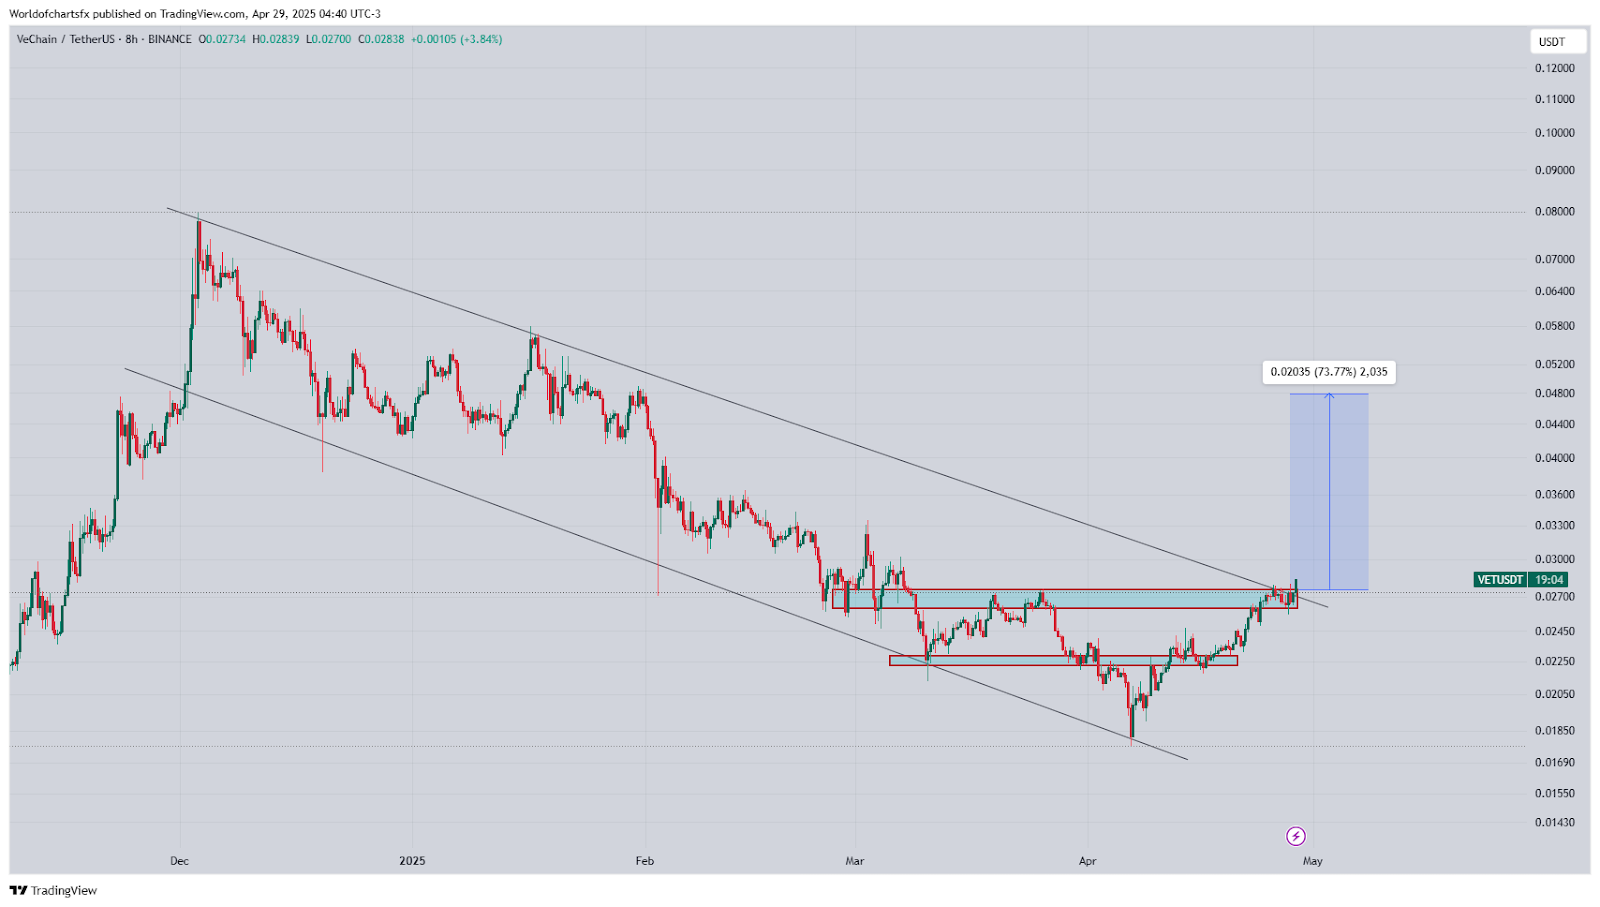
8-hour VET/USDT Chart | Source: World of charts on X
A consolidation to $0.0245 – $0.0270 preceded the breakout, which took place right above $0.027. The horizontal resistance at these levels had previously halted multiple attempts to be bullish.
A shift in the mid-term trend occurred due to the breach of this resistance zone, along with the breakout of the overall descending channel.
The chart also set a projected price of $0.048 based on the previous price channel’s width. To confirm the bullish thesis, if follow-through volume continues to be validated, the breakout level would suggest a potential 73.77% gain.
The technical breakout was further contextualized by onchain market data integrated from CoinMarketCap. VeChain traded at $0.02732 at press time, up 4.88% in the last 24 hours. VET’s price recovered from the intraday dip, and its market cap stood at $2.31 billion.
The trading volume was $38.2 million as of the same period. On the other hand, the volume to market cap stood at 1.62%. That indicated healthy market participation.
On the price chart, this visual breakout in market structure perfectly aligned with the chart breakout itself. It indicated that if the resistance-turned-support around $0.027 could hold, there could still be much further to continue upwards.
4-hour Charts Suggested Caution on the VeChain Price
The macro setup was bullish, but the 4-hour chart showed a short-term caution. At the time of writing, VeChain price was just underneath a lower trendline on a rising wedge, with the price at $0.02691.
If a measured breakdown occurs, then the move from the wedge’s height projects a pullback target to around the $0.0223 mark.
The Awesome Oscillator was near neutral, and the recent histogram bars turned green to red. That indicated a neutral market momentum. Furthermore, the Average Directional Index (ADX) was at 23.94 at press time. It showed that although there was a trend, the current directional strength wasn’t strong.
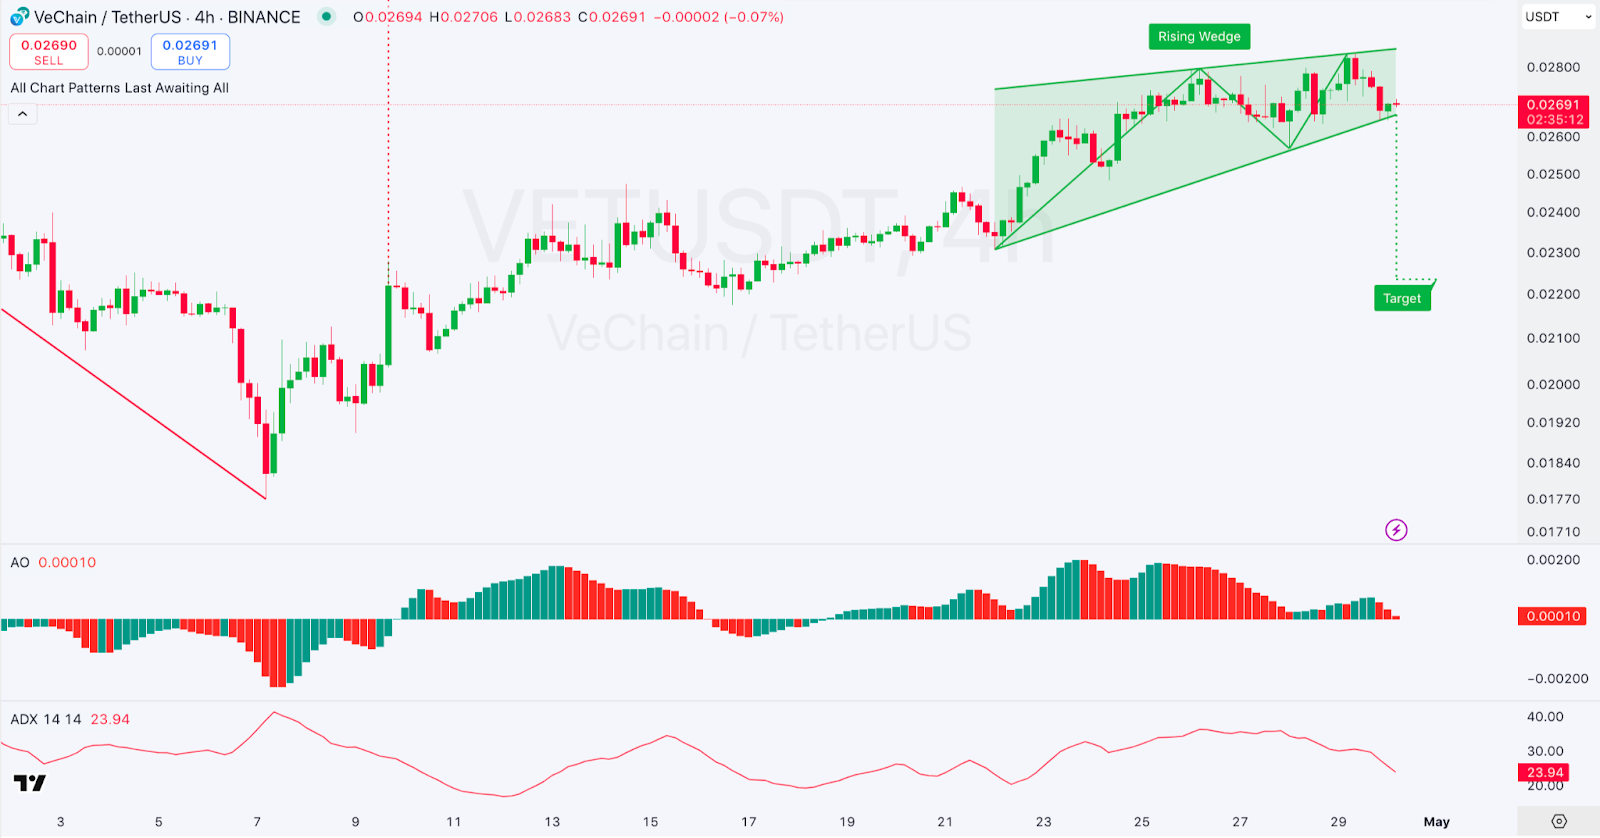
4-hour VET/USDT Chart | Source: TradingView
Together, these indicators and the wedge’s structure indicated that a pullback could come before the next up moves are ratified. The $0.027 breakout is technically important, having acted as major resistance in the months of March and April.
That would confirm the bullish breakout. Moreover, it would also confirm the possibility of 73% upside.
The bullish trend can continue, and the wedge may be invalidated without breaking down. The move could swiftly lead to the retracement of the $0.030 price zone. After that, no further support may be present until $0.035. It will be the next resistance.
At the end, by taking resistance at $0.048, we will reach the breakout chart. Such a move would align VET’s trend with broader altcoin market recovery patterns. This trend looks ready to begin again and again, and another one may follow suit.
However, if the wedge goes bearishly, support could be near $0.024 and $0.022. Such a breakdown to these levels would not entirely negate the macro breakout. It would serve as a major bearish caution to delay any major bullish continuation.


Leave a Reply