
Ethereum (ETH) market maintains its position below important resistance zones, as April ends with technical indicators supporting a rising bearish market sentiment. Ethereum traded around $1,760 on April 30 after experiencing a 3.06% price decrease in 24 hours, and failed to break the $1,800–$1,825 resistance area.
TradingView data showed that the price established a clear downward trend with weakening peaks during the previous week. ETH experienced strong resistance at $1,850, while support was $1,750. The closing price of the daily candle on April 30 reached $1,771.80, demonstrating persistent selling pressure among investors across short timeframes.
Whales took advantage of the recent price surge, selling 262,000 #Ethereum $ETH, worth around $445 million. pic.twitter.com/sQ0PhAzyfX
— Ali (@ali_charts) April 29, 2025
Technical Indicators Signal Continued Weakness
The technical indicators point toward no upcoming bullish trend behavior. The bearish crossover continued to deepen in the 4-hour MACD, with the MACD line at 4.89 while the signal line reached 10.45. Technical indicators showed the RSI reaching 42.36, signaling increasing market bearishness.
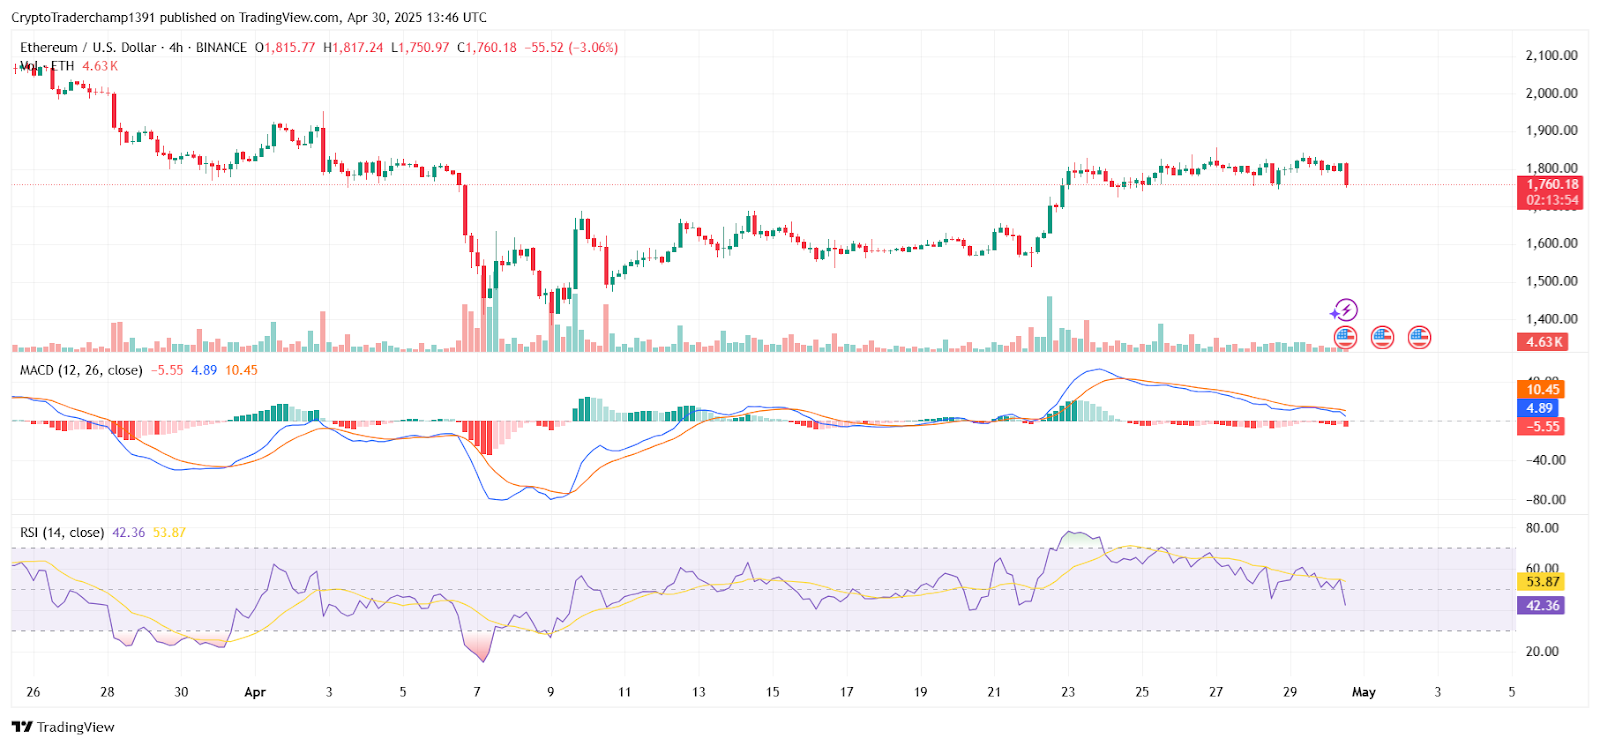
Source: TRADINGVIEW
Support Levels Come Under Pressure as Volume Drops
In addition, on-chain volume and technical chart patterns point towards further downside for ETH. Trading volume for Binance within the last 4 hours was 4.63K ETH, which shows that interest in this pump was low. Meanwhile, DEX activity plummeted with approximately $1.439 billion in daily volume, well below average ranges of DEX activity seen in 2023 and early 2024.
Ethereum resisted falling below the $1,743 support area at press time, remaining trapped within the Fibonacci zone, extending from $1,784 to $1,743. Once the price falls below the critical price point of $1,743, which coincides with the 50% Fibonacci level, the next support level stands at $1,710. Below that, $1,677 serves as the next probable target.
The realized cap and “hot capital” inflow chart from Glassnode showed a 66.9% rise in capital circulation over the past two weeks, reaching $4.34 billion. However, this surge was led by short-term holders, making the market vulnerable to quick exits if prices drop.
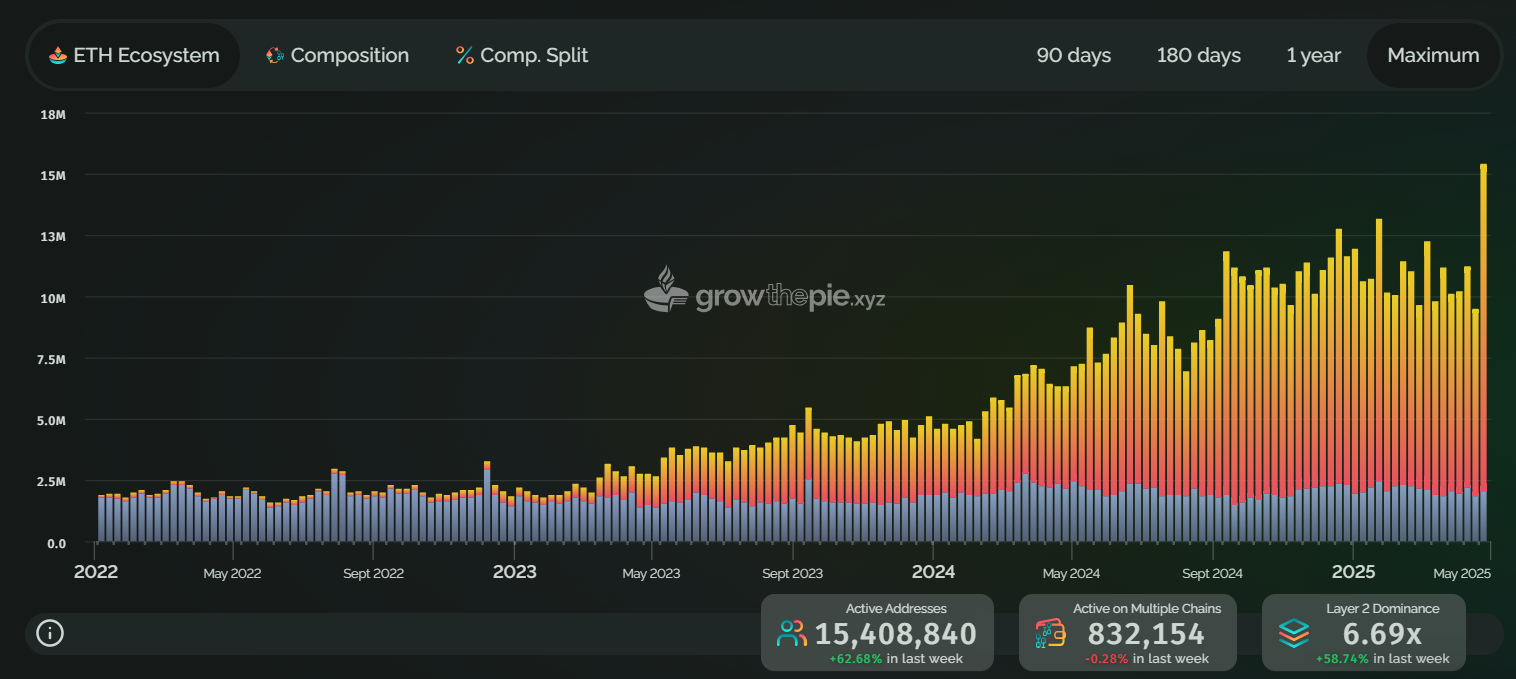
Layer 2 Growth Contrasts Short-Term Market Weakness
According to data from GrowThePie.xyz, the Ethereum network reached its all-time peak with 15.4 million active addresses in April, while Layer 2 adoption exceeded Layer 1 usage by 6.69 times. However, the current price movement of ETH remains limited because spot market demand is weak and investor confidence is low.
In his roadmap, Vitalik Buterin, the co-founder of Ethereum, defined two key development goals for the network: achieving single-slot finality and stateless architecture. The outlined future developments will boost privacy and scalability, while they should not impact Ethereum’s near-term market performance.
Outlook: Further Declines Possible Without Breakout
Further downside for ETH seems probable in the near term unless the price can decisively push above the $1,825 resistance level with sustained volume to reclaim $1,800.
If $1,750 breaks, a significant increase in bearish pressure could cause Ethereum to fall to either $1,710 or $1,677 during the first week of May.
Disclaimer: The information presented in this article is for informational and educational purposes only. The article does not constitute financial advice or advice of any kind. Coin Edition is not responsible for any losses incurred as a result of the utilization of content, products, or services mentioned. Readers are advised to exercise caution before taking any action related to the company.


Leave a Reply