
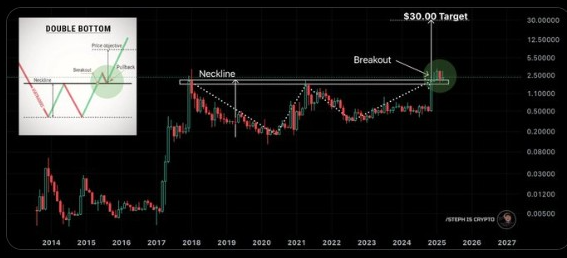
XRP price crossed a decisive neckline resistance point which signals a confirmed breakout of its double-bottom pattern. A confirmed double-bottom pattern serves as an often recognized bullish reversal sign indicating future potential for strong price appreciation.
A technical analysis review shows the crossover beyond the neckline is an essential transformative point. Chart patterns feature a neckline which functions as a barrier until it breaks resulting in heightened bullish market sentiment.
Technical analysts report that XRP price exceeding the resistance threshold matches past patterns by creating substantial market gains after similar breakout occurrences.
Analysts Predict a XRP Price to $30
Technical analysis indicators combined with historical price behavior suggest XRP could reach $30 in the future. During a price uptrend analysis the double bottom pattern indicates that downward trends will end and price recovery will start.
Market movement towards this support level confirms strong buying interest which supports rising price expectations.
Analysts use historical data to determine price targets by studying double-bottom breakouts which historically led to higher prices.
The present breakout momentum along with market variables decide whether Ripple will reach this target price. Steph Is Crypto predicts that sustained bullish trends might propel XRP price to skyrocket throughout the forthcoming months.
Source: X
Additionally, a recent report highlights the Ripple token’s bullish momentum, with analysts closely monitoring key resistance levels at $2.70 and $3.05. Additional price growth can occur following successful breakout confirmation yet non-validation may lead to market stability within the $2.57-$2.70 range.
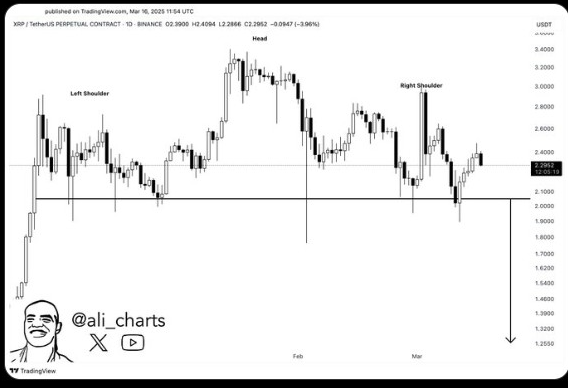
XRP Price Must Hold $2 Support to Avoid Drop to $1.25
The double-bottom pattern suggests upward potential but an opposing technical formation threatens to disrupt this positive trend. XRP displays a rising head-and-shoulders pattern according to analyst Ali Martinez on its weekly chart.
The pattern commonly signals an upcoming market drop which would be confirmed upon its completion.
Source: X
Market analysts recommend monitoring the $2 support area as the primary level of interest. Multiple analysts indicate that the previous support from this level risks potential downward price movement if it breaks down. Failure to sustain XRP price at its current level would create opportunities for falling to $1.25.
Market Sentiment and Technical Levels Drive Price Action
XRP price movement will depend on the way it relates to its fundamental technical levels. A bullish breakout that occurs above the neckline indicates potential price appreciation although the $2 support serves as a vital element for preserving upward price movement.
Adding to the bullish sentiments, the Moving Average Convergence Divergence (MACD) indicator on the XRP/USD chart has just crossed above the signal line, signaling a potential bullish shift. This crossover suggests growing buying pressure, which could drive XRP pricehigher if sustained.
The changing pattern of MACD histogram from red to green provides additional support for the bullish trend. Ripple’s upward price trajectory holds the potential to challenge additional resistances while targeting a $30 price goal.
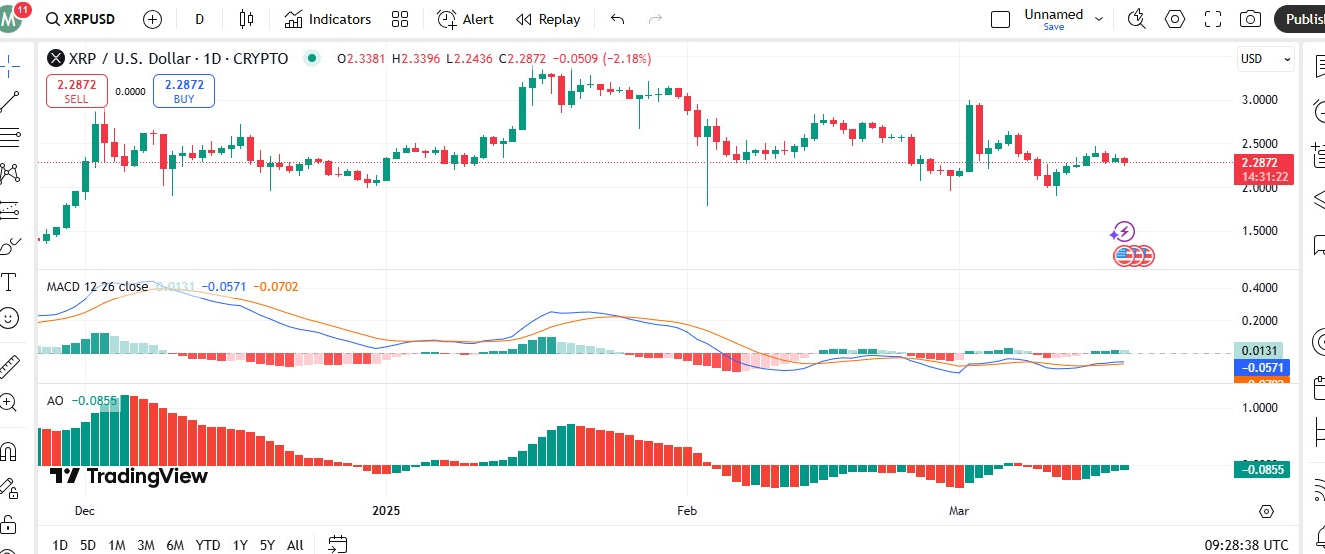
Source: TradingView
Similarly, the Awesome Oscillator is currently indicating green bars which suggest that this bearish momentum is weakening. The declining red bars demonstrate decreasing selling pressure which indicates a positive potential for a bullish reversal. A bullish signal emerges when the AO maintains green bars and approaches the zero line.


Leave a Reply