
Ethereum breaks key levels but struggles at $1,800. Could growing network activity and increasing long positions spark a move toward $2,000?
As the crypto market recovery pauses, Bitcoin drops below $93,000, while Ethereum continues to struggle below the $1,800 level. Currently, Ethereum is trading at $1,769, showing an intraday pullback of nearly 1.5%.
While Ethereum continues to face resistance, optimistic traders anticipate a post-retest bounce. Could this recovery push the price past the $2,000 mark? Let’s find out.
Ethereum Price Analysis
On the 4-hour price chart, Ethereum’s trend showcases a bullish breakout from a long-standing supply zone, surpassing the 38.20% Fibonacci level near $1,675.
Following this breakout, Ethereum rallied past the 50% Fibonacci level and the 200 EMA line near $1,755. However, the uptrend failed to maintain momentum above the $1,834 mark, resulting in short-term consolidation and a minor pullback.
This current pullback may be a potential retest of the 200 EMA line and the 50% Fibonacci level. Notably, the recovery has positively influenced the 50 and 100 EMA lines, hinting at a possible bullish crossover.
Furthermore, the bullish recovery has extended the uptrend in the MACD and Signal lines, signaling strong bullish momentum. As a result, technical indicators support the likelihood of a post-retest reversal in Ethereum’s price.
Based on the Fibonacci levels, a successful post-retest reversal that breaks above the 61.80% Fibonacci retracement ($1,834) could open the door for Ethereum to reach $2,000. Such upward momentum would also increase the chances of a golden crossover between the 50 and 200 EMA lines—a strong bullish signal.
Conversely, if Ethereum fails to hold above the 50% Fibonacci level, the price could retrace further to test the $1,675 support-turned-resistance zone.
Analyst Signals Major Ecosystem Boost Incoming for Ethereum
Amid Ethereum’s recent bullish recovery, a new analysis by Carmelo Alemán, an analyst at CryptoQuant, highlights a major boost in network activity. He notes a sharp increase in active Ethereum addresses from 306,211 to 336,336 in just 48 hours.
This represents a nearly 10% surge between April 20 and April 22. The analyst also notes overall growth in Ethereum active addresses alongside the broader market recovery.
Carmelo projects a potential expansion in the broader Ethereum ecosystem, which could serve as a launchpad for multiple projects built on Ethereum. As the ecosystem grows, demand for ETH is expected to rise, potentially driving prices higher.
Ethereum: Active Addresses
Bullish Traders Bet Big on Ethereum Breakout Rally
As price action analysis suggests a potential rebound, bullish sentiment in Ethereum’s derivatives market continues to grow. According to Coinglass data, long positions in the derivatives market are nearing 55%.
Based on Coinglass’s Long-to-Short Ratio chart, long positions now account for 54.98%, driving the ratio to 1.02. This marks a notable increase over the past three hours, up from 46.3%.
With renewed optimism for a breakout rally, derivatives traders are betting big on Ethereum. According to the Ethereum exchange liquidation map, a breakout above $1,800 could lead to significant short liquidations.
The data indicates a cumulative short-liquidation potential of $317.36 million near the $1,809.60 level.
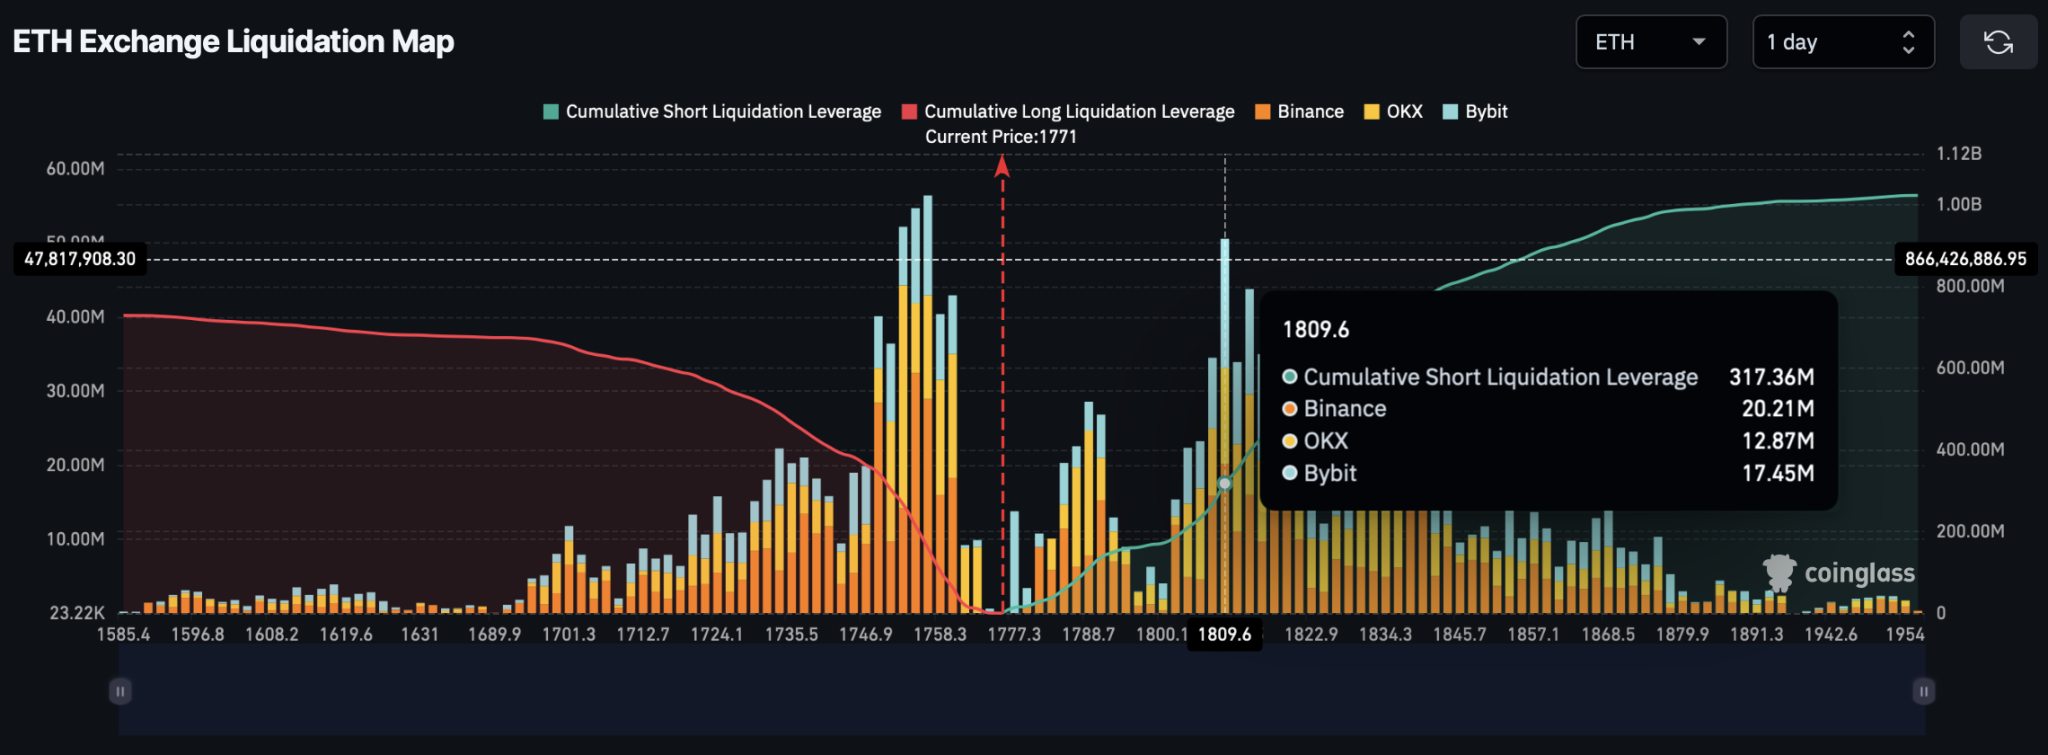
Liquidation Map


Leave a Reply