Analyst highlights historical patterns set out by Dogecoin and the meme coin’s recent breakout, predicting potential for a rally.
Dogecoin (DOGE) has been on a steady upward trajectory over the past week, demonstrating a 5.2% gain as it rose from $0.13 on April 9 to around $0.15. The token is now testing a crucial resistance level at $0.16, which has capped its price recently.
Despite the overall upward movement, Dogecoin has experienced moderate volatility, including minor retracements on April 12 and 13. Currently, the price has seen a slight 2.08% decline over the past 24 hours.
Dogecoin’s Historical Patterns
Amid these movements, analyst Trader Tardigrade has examined Dogecoin’s price action using a 3-day chart that spans from 2014 to the present, which highlights key technical patterns. The chart displays a series of symmetrical triangle formations that have historically preceded significant breakouts.
Dogecoin Price Prediction
The first triangle formed between 2014 and 2016, during which Dogecoin saw a downward price trend before breaking out to $0.004 and then consolidating underneath a descending trendline. This led to another breakout and subsequent surge in mid-2017. It sustained this run until January 2018, eventually hitting a new all-time high of $0.0187.
Similarly, the second symmetrical triangle, which developed between 2018 and 2021, followed a comparable pattern with a breakout that eventually resulted in a sharp price rally, peaking at the latest all-time high of $0.74.
After Dogecoin collapsed from this peak as the 2021 bull run cooled, it formed a third symmetrical triangle. However, it finally broke out of this third triangle in late 2024 and sustained the breakout until recently, with the recent drop allowing it to retest the descending trendline.
According to Tardigrade, the latest breakout signals a potential for another upward move, with an anticipated price target of $2.9. With Dogecoin currently trading to $0.1593, a run to $2.9 would demand a 1,593% rally. Interestingly, last November, analyst Scofield already predicted a DOGE surge to $3.
Ali Martinez’s Separate Insights
Ali Martinez has also weighed in on Dogecoin’s price movement, offering insights into the coin’s recent price fluctuations. Martinez points out that Dogecoin retraced from its yearly high of $0.485 before stabilizing at the $0.145 level, which aligns with a rising trendline that began in November 2023.
The price has previously tested the trendline level twice, failing to break below it. Martinez suggests that as long as Dogecoin holds above the $0.13 support, it may be poised for a significant move upward. A close above $0.17 could potentially open the door to higher price levels, including $0.21 or even $0.29.
Bullish Sentiment Supported by Address Activity
Meanwhile, data on Dogecoin’s address activity further supports the optimistic outlook for the coin. The number of new addresses has surged by 102.4% in the past week, signaling a strong influx of new participants into the ecosystem.
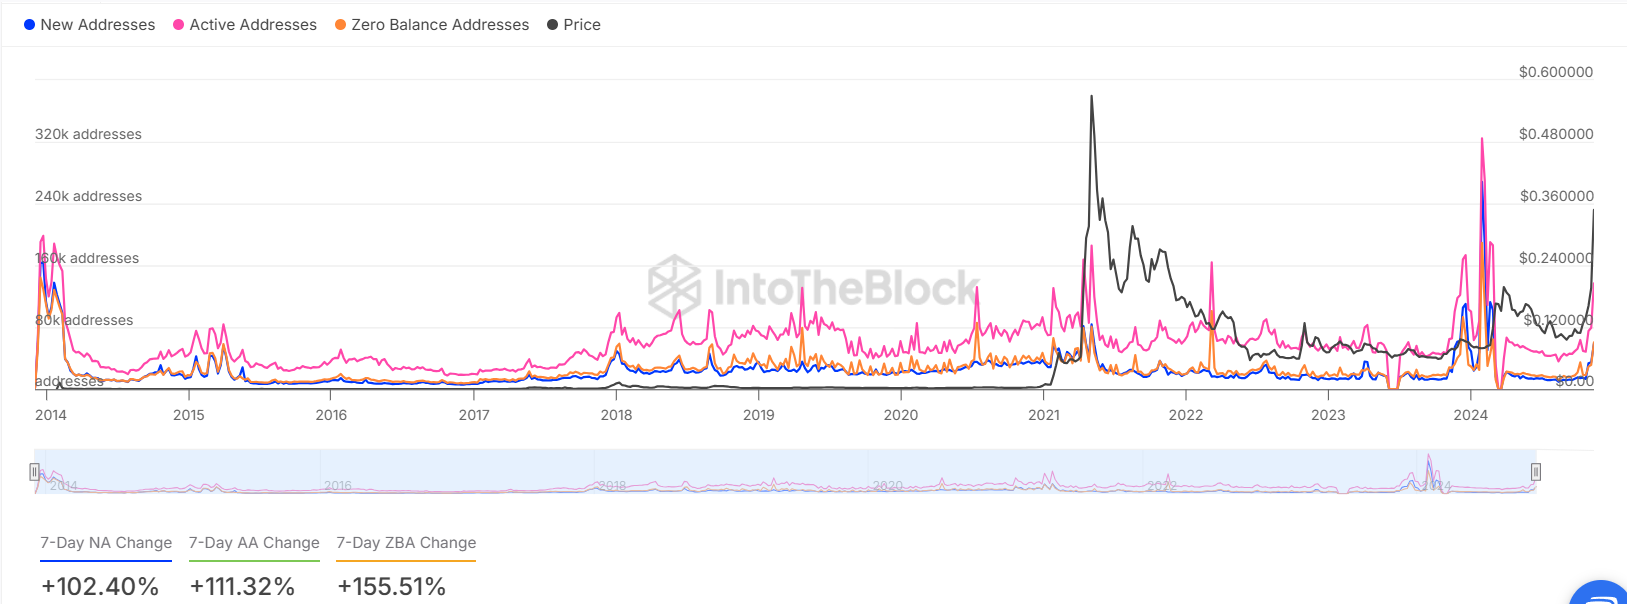
Dogecoin Daily Active Addresses
This is mirrored by a 111.32% increase in active addresses, indicating growing engagement with the token. Additionally, the number of zero-balance addresses has risen by 155.51%, suggesting the creation of new wallets or changes in holdings within the Dogecoin network.


Leave a Reply