The Ethereum price today is trading around $2,478, down nearly 2% in the past 24 hours, as bearish pressure weighs on the recent breakout attempt above $2,540. Despite ETH holding above its May support zone last week, the latest candle formations and volume flow suggest renewed selling interest. The move has raised concerns over short-term downside risk, particularly as indicators align with a weakening momentum phase.
Ethereum Price Action: Breakdown Below $2,500 Triggers Bearish Reversal

ETHUSD price analysis (Source: TradingView)
The Ethereum price action has slipped below a key ascending trendline that had supported the rally from early May. On the 30-minute and 4-hour charts, ETH has now broken below the $2,500 threshold, creating a lower high formation below the $2,560 rejection zone.
The move confirms a potential breakdown from a rising wedge pattern, with sellers reclaiming control after multiple failed attempts to break $2,580. Red resistance zones between $2,560 and $2,600 are now acting as firm ceilings, while ETH eyes a retest of horizontal support at $2,445 and $2,420.
RSI and MACD Show Accelerating Bearish Momentum

ETHUSD price analysis (Source: TradingView)
The RSI on the 30-minute chart has slipped to 28.8, entering oversold territory for the first time in several sessions. This sharp drop in RSI reflects a spike in Ethereum price volatility, where sellers have overwhelmed intraday buyers after the breakdown.
Meanwhile, the MACD indicator shows a clear bearish crossover. Both the MACD and signal lines are trending downward, supported by expanding red histogram bars. This shift reinforces the narrative of a bearish wave building below the $2,500 threshold, especially as ETH struggles to reclaim previous support.
Ichimoku and Bollinger Bands Indicate Trend Weakness
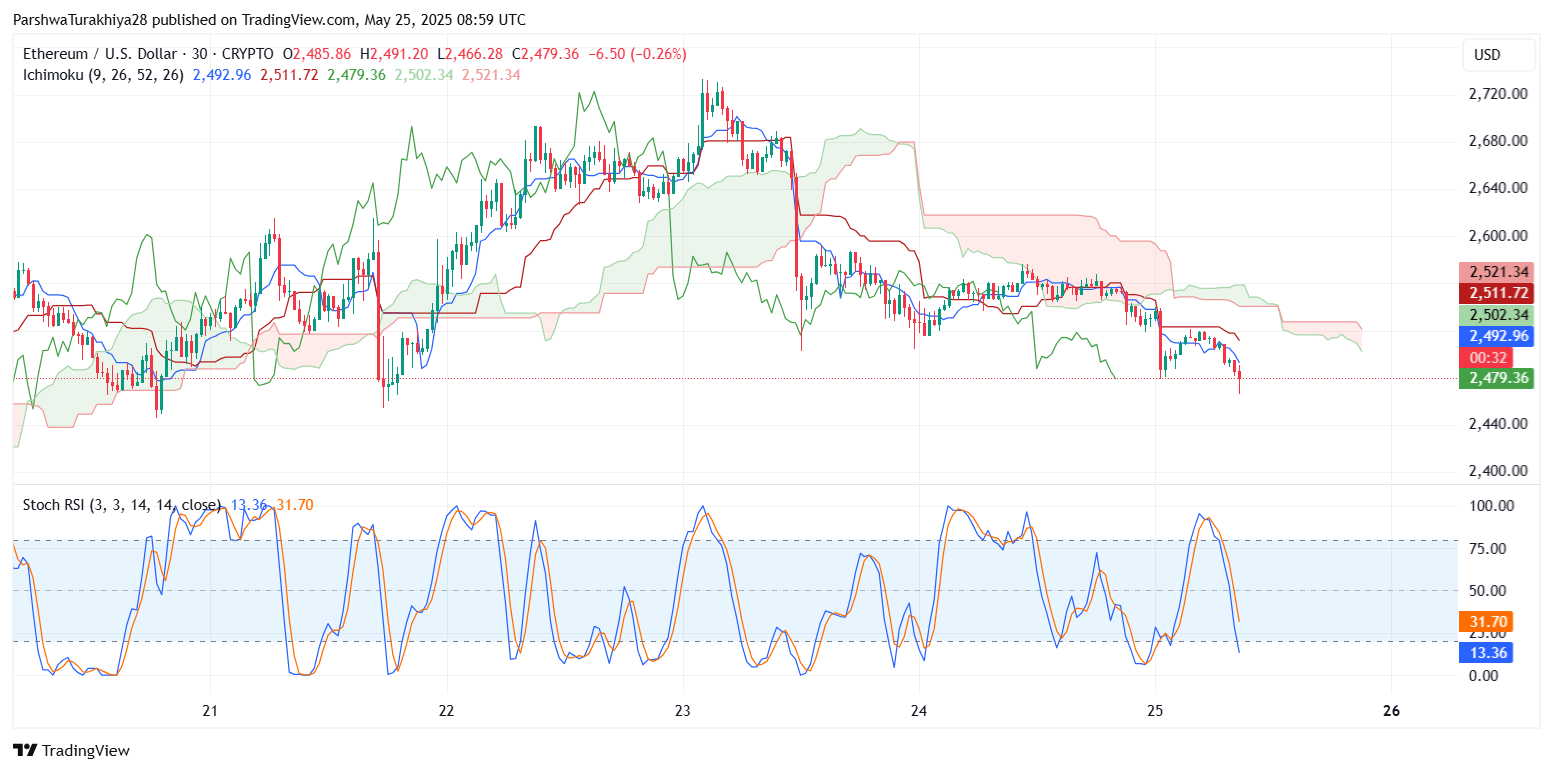
ETHUSD price analysis (Source: TradingView)
The Ichimoku Cloud indicator on the 30-minute and 1-hour charts shows that Ethereum price today is now trading below the cloud base, with the Tenkan-sen and Kijun-sen lines crossing bearishly. The price structure remains beneath the baseline (Kijun), hinting at further weakness unless ETH recovers above $2,500 swiftly.

ETHUSD price analysis (Source: TradingView)
Bollinger Bands on the 4-hour chart are also widening as ETH touches the lower band near $2,480. This indicates increasing volatility and a rising chance of follow-through selling if bulls cannot generate a bounce soon. The middle band at $2,535 and the upper band near $2,583 now represent stiff short-term resistance levels.
Weekly Fibonacci and Daily Trendlines Show Mixed Long-Term Setup

ETHUSD price analysis (Source: TradingView)
Zooming out, the weekly Fibonacci retracement indicates that ETH is trading below the 0.5 level at $2,745 and struggling to hold above the 0.382 level at $2,424. This Fibonacci zone between $2,420 and $2,745 is crucial for defining the broader bias. A close below $2,420 would invalidate the bullish thesis and open the door for a test of the 0.236 level near $2,027.

ETHUSD price analysis (Source: TradingView)
On the daily chart, Ethereum has rejected the upper boundary of the descending trendline that connects the $3,000 and $2,800 peaks from March and April. Unless ETH breaks back above $2,560 and reclaims the $2,600 pivot, the larger structure now leans bearish.
Ethereum Price Prediction for May 26

ETHUSD price analysis (Source: TradingView)
If Ethereum price fails to close back above $2,500, the downside trajectory could continue toward $2,445 and $2,420. A deeper sell-off could expose the $2,300–$2,260 support band, which aligns with the 200 EMA and a key confluence zone seen earlier in May.
On the upside, a reclaim of $2,540 and a close above $2,560 would shift sentiment back in favor of buyers, with next resistance at $2,600 and $2,733—the April high. However, with momentum turning bearish and structure failing to hold, traders may approach bounce attempts with caution.
Unless bulls regain control quickly above the $2,500 level, Ethereum risks slipping further into a corrective phase. The next 24 hours will be critical in defining whether this move is a breakdown or just another pullback inside a broader accumulation range.
Disclaimer: The information presented in this article is for informational and educational purposes only. The article does not constitute financial advice or advice of any kind. Coin Edition is not responsible for any losses incurred as a result of the utilization of content, products, or services mentioned. Readers are advised to exercise caution before taking any action related to the company.


Leave a Reply