
Ethereum’s market sentiment has shifted notably as the prediction market on Polymarket now shows a 72% chance that the cryptocurrency will remain above $2,500 on May 16, 2025.
This jump represents a 22% surge in trader confidence, sparked by rising optimism and increased trading activity over recent days. The change in sentiment reflects a broader trend where traders are recalibrating their outlook based on both technical indicators and market psychology.
Polymarket Prediction Sees High Volume, Investor Conviction
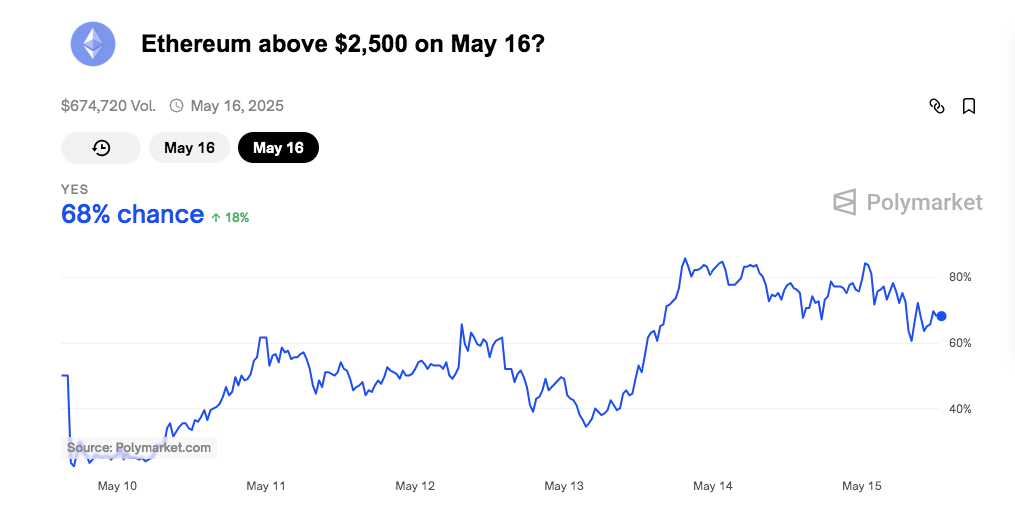
Source: Polymarketcap
Besides the rise in probability, the market has drawn significant attention. Trading volume for this particular prediction reached $674,720, showing strong participation and conviction among speculators.
Interestingly, this surge in confidence came despite Ethereum’s short-term dip, suggesting that investors may be focusing on longer-term fundamentals rather than daily fluctuations.
Related: ETH Outlook Brightens: Hedge Funds Shift to Favor Ethereum
ETH Price Action and Key Technical Levels to Watch
At the time of writing, Ethereum is trading at $2,554.71, marking a 2.86% daily decline. This drop follows a sharp reversal from recent highs near $2,650. The chart pattern shows a series of lower highs and lower lows, which generally points to a bearish short-term trend. However, the bigger picture may tell a different story.
Support and resistance levels are becoming more defined. Immediate resistance stands at $2,595, a level that has rejected price advances several times recently. Further resistance lies at $2,625, which was the local high before the current pullback. If bulls manage to push the price above this zone, it could mark the beginning of a short-term rally.
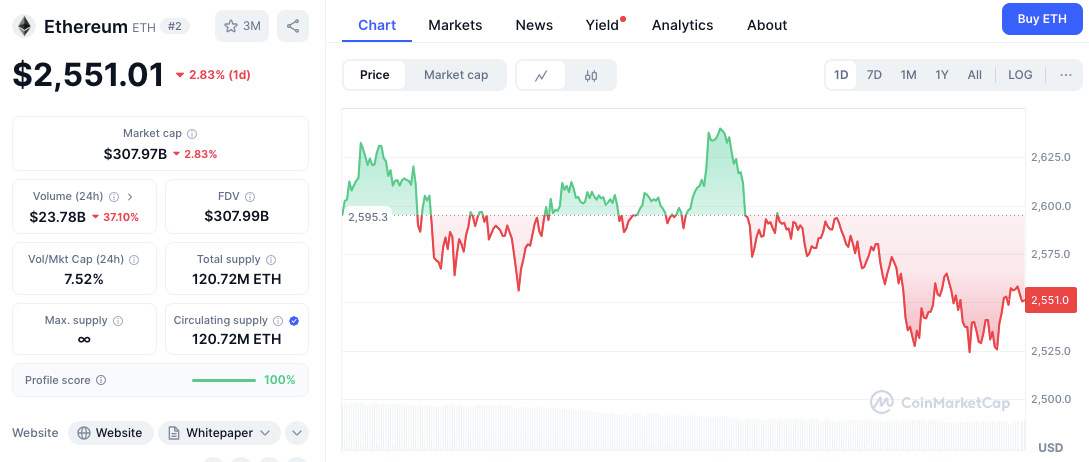
Source: CoinMarketCap
On the downside, key support is at $2,525, where the price bounced earlier. A more critical level lies at $2,500. This zone carries both psychological weight and technical importance. A breakdown below this could open the door to further losses, potentially eroding the recent bullish sentiment.
Momentum Indicators: ETH Overbought on RSI, MACD Still Bullish
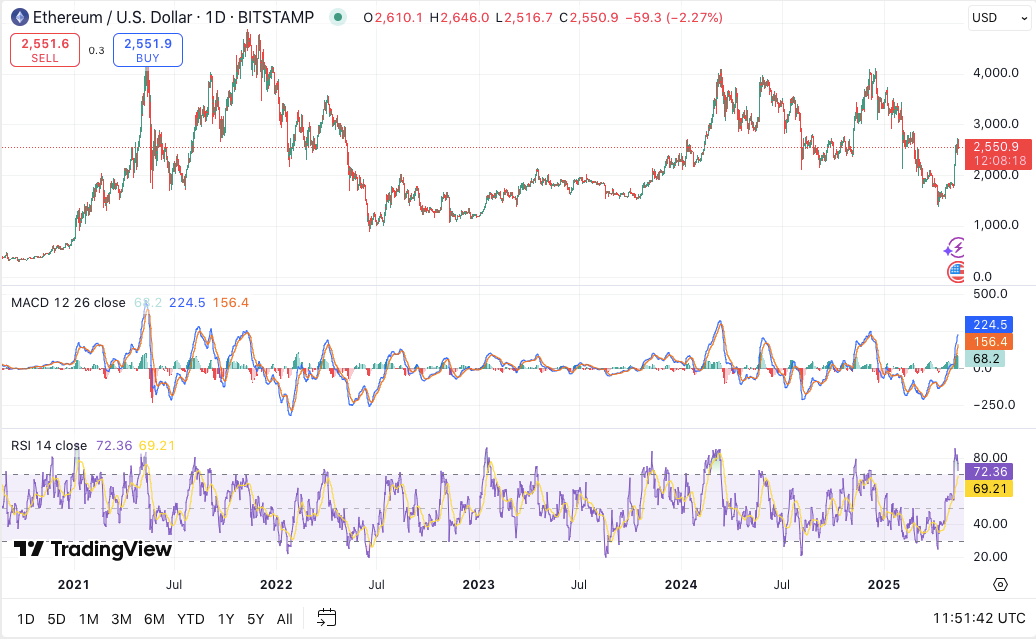
ETH/USD daily price chart, Source: TradingView
From an indicators perspective, the RSI is currently at 72.25, which places Ethereum in overbought territory. This suggests that a short-term pullback or price consolidation is possible. Overbought conditions often precede market corrections, though they don’t always signal long-term weakness.
Related: ETH Price Remains Strong Above $2.5K Despite Wild Exchange Flows & Huge $1.2B Withdrawal
Meanwhile, the MACD remains in bullish alignment, with the MACD line above the signal line. This crossover points to ongoing upward momentum, but declining price action may soon weaken this signal. A narrowing gap between these lines could signal a momentum shift if price support fails to hold.
Disclaimer: The information presented in this article is for informational and educational purposes only. The article does not constitute financial advice or advice of any kind. Coin Edition is not responsible for any losses incurred as a result of the utilization of content, products, or services mentioned. Readers are advised to exercise caution before taking any action related to the company.


Leave a Reply