
- Bitcoin price stabilizes around $104,000 on Monday after rallying by 10.44% last week.
- Ethereum price finds support around its 200-day EMA at $2,431, signaling bullish resilience.
- XRP stabilizes at $2.38 following a near 10% weekly jump.
Bitcoin (BTC) price is stabilizing at around $104,000 on Monday after rallying by 10.44% last week. Ethereum (ETH) and Ripple (XRP) followed BTC’s lead and soared 39% and nearly 10% in the previous week.
Bitcoin bulls show signs of exhaustion
Bitcoin price broke and closed above the daily resistance level at $97,700 on Thursday and rallied 8.19% until Saturday. However, after such a massive rally, BTC faced a slight pullback on Sunday at around $105,000. At the time of writing on Monday, it continues to face resistance around this level and trades slightly down around $103,800.
If BTC continues to face a pullback, it could extend the decline to retest its psychological level at $100,000.
The Relative Strength Index (RSI) on the daily chart reads 73, above its overbought level of 70, and points downward, indicating signs of bullish exhaustion. If RSI continues to move below its overbought levels, it could indicate a decrease in bullish momentum and a fall in Bitcoin’s price.
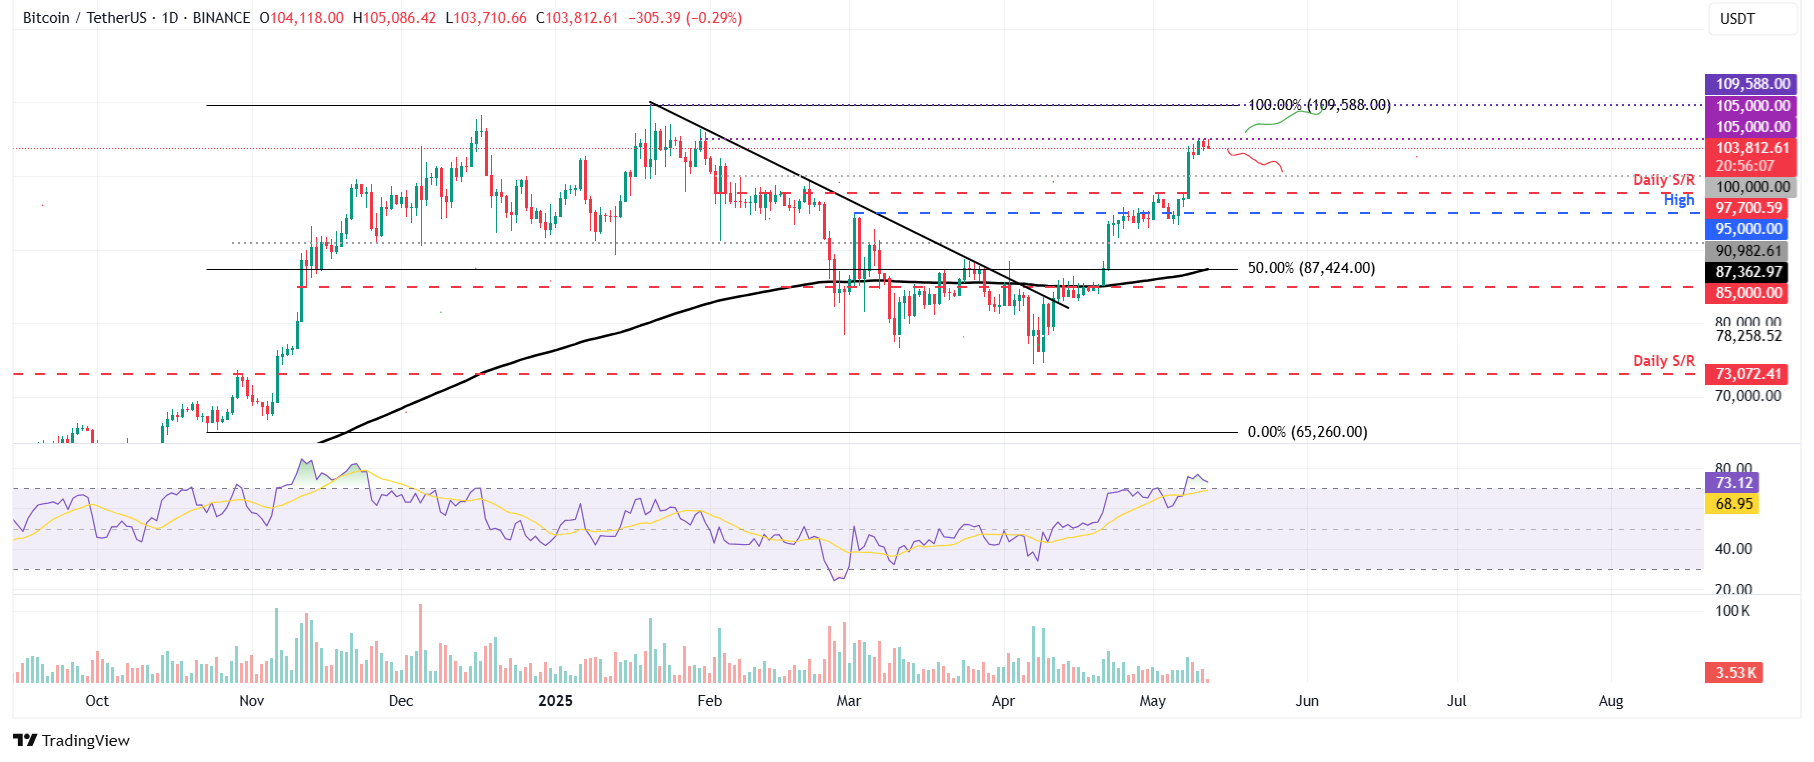
BTC/USDT daily chart
However, if BTC breaks and closes above its $105,000 resistance level, it could extend the rally toward its all-time high of $109,588.
Ethereum finds support around its 200-day EMA
Ethereum price broke above the descending trendline (drawn by joining multiple high levels since early January) on Thursday and rallied 44%. On Saturday, it broke above its 200-day Exponential Moving Average (EMA) around $2,427. At the time of writing on Monday, it hovers at around $2,513.
If ETH finds support around its 200-day EMA and rebounds, it could extend the rally to retest its key psychological level at $3,000.
The RSI on the daily chart reads 79 above its overbought levels of 70, indicating strong bullish momentum. However, traders should be cautious as the chances of a pullback are high due to its overbought condition. Another possibility is that the RSI remains above its overbought level of 70 and continues its upward trend.
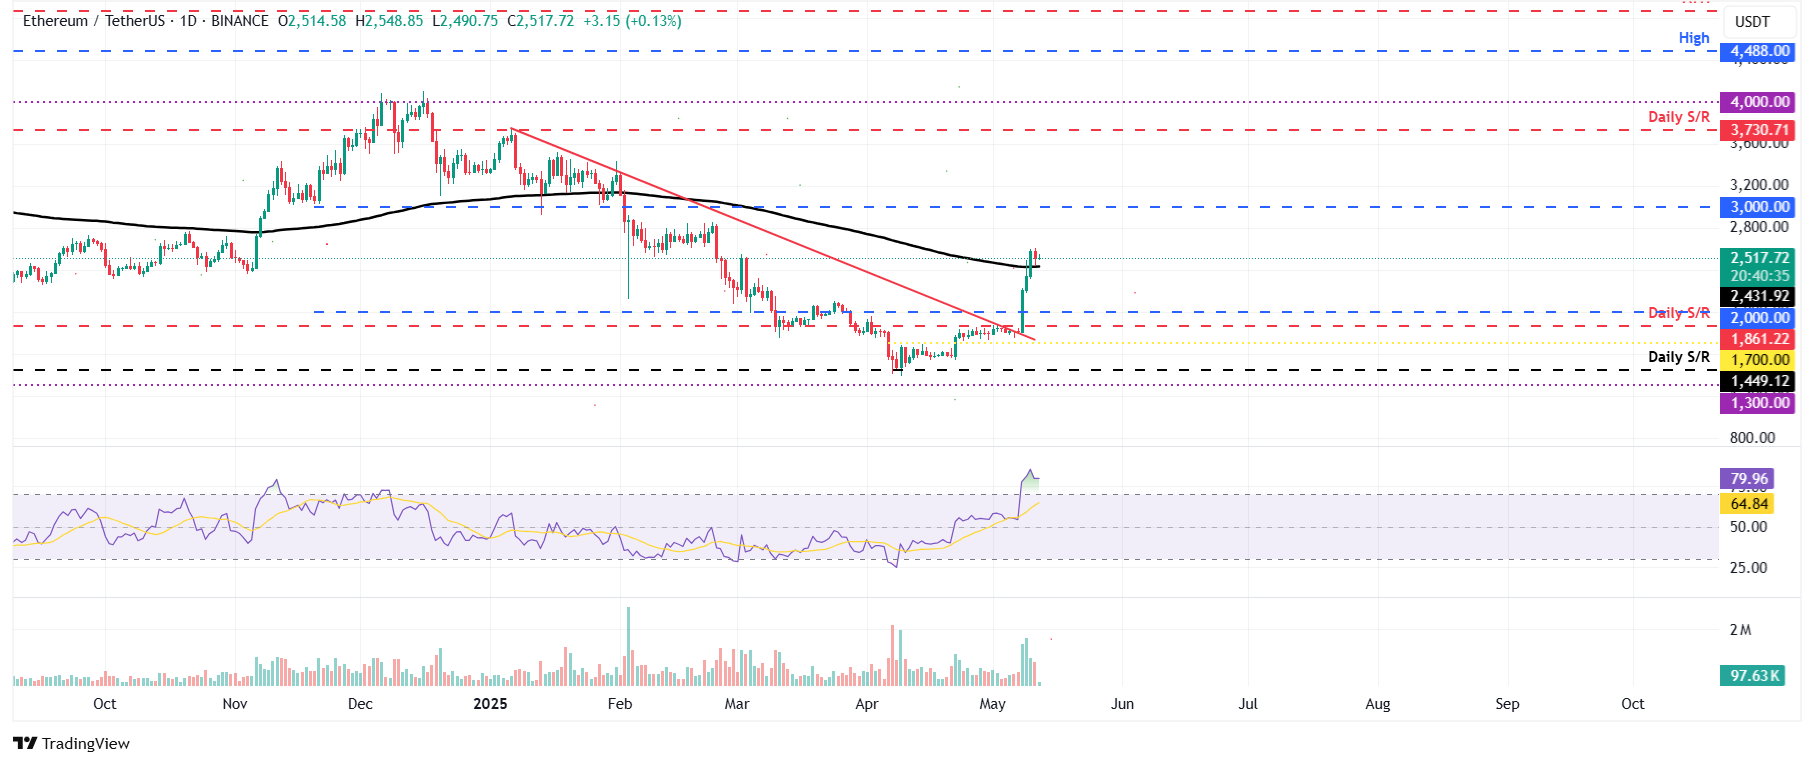
ETH/USDT daily chart
Conversely, if ETH closes below its 200-day EMA at $2,431, it could extend the decline to retest its key psychological level at $2,000.
XRP shows potential for a rally ahead
XRP price broke and closed above its 50-day EMA level at $2.20 on Thursday and rallied 16.69% until Saturday. However, it faced a slight pullback the next day. At the time of writing on Monday, it hovers at around $2.38.
If XRP continues its upward trend, it will extend the rally to retest its March 24 high of $2.50 before potentially reaching $3.00.
The RSI on the daily chart reads 60, above its neutral level of 50, indicating a bullish momentum.
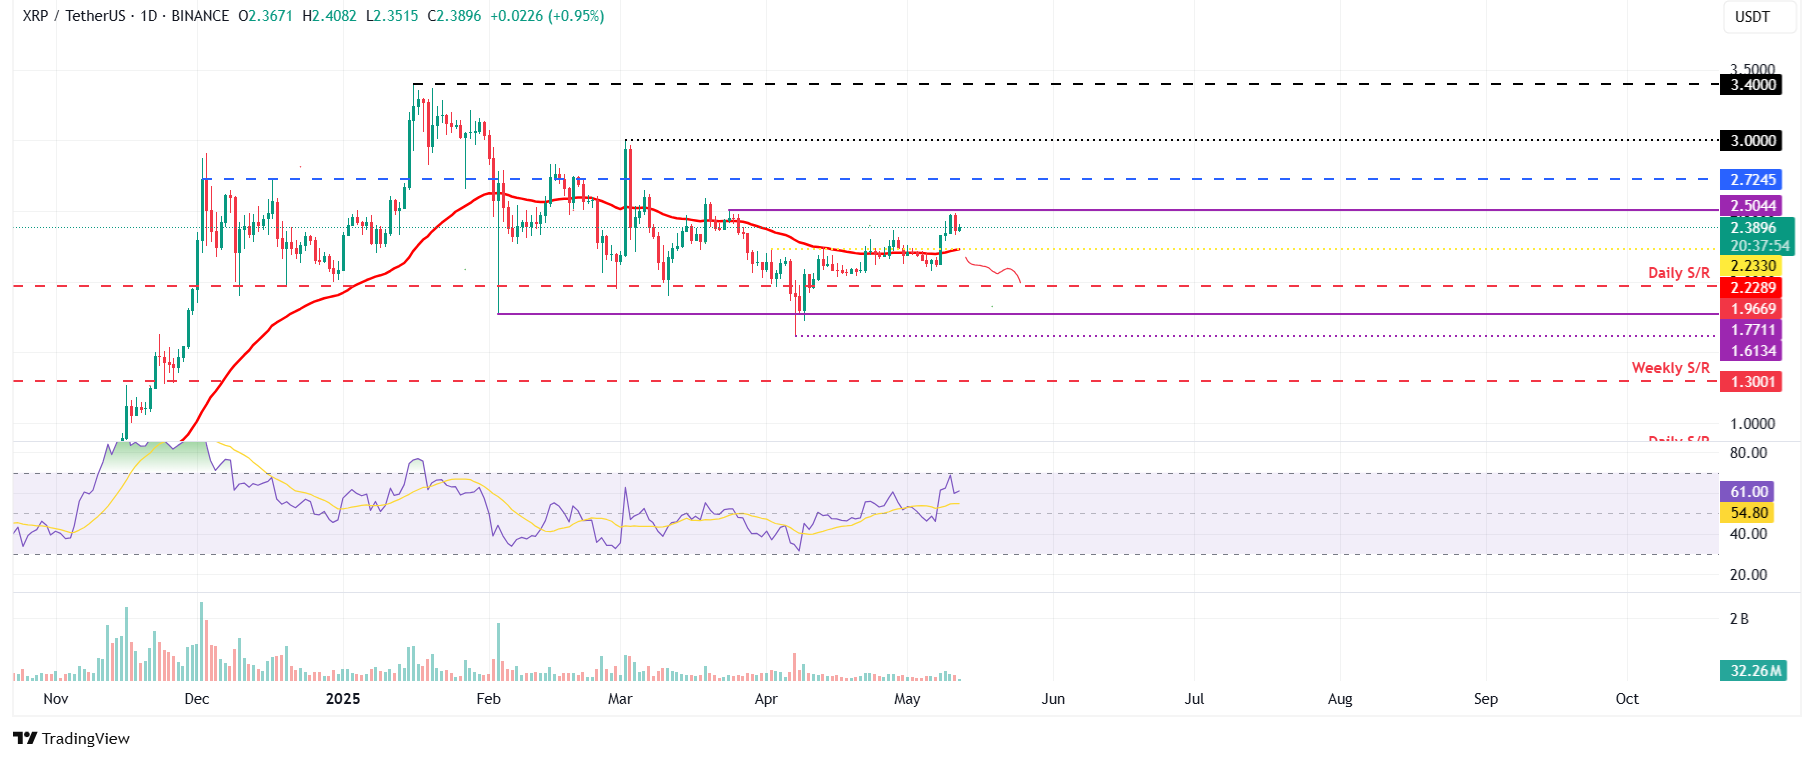
XRP/USDT daily chart
On the other hand, if XRP faces a pullback, it could extend the correction toward its 50-day EMA at $2.20.


Leave a Reply