
- Bitcoin (BTC) trades at $104,200, up 1.00% with a $2.06T market cap.
- Support stands at $102K; a breakout above $105K could target $107.5K.
Bitcoin (BTC) briefly reclaimed the $104,000 threshold today, posting a modest 1.00% intraday rise. At the time of writing, BTC trades at $104,200.09, securing a market capitalization of $2.06 trillion. This reflects a 0.73% increase in tandem with a strong surge in trading volume, now totaling $47.02 billion, up by nearly 20%.
Bitcoin’s fully diluted valuation stands at $2.18 trillion, while the circulating supply has reached 19.86 million coins, closing in on its 21 million cap. The volume to market cap ratio of 2.32% indicates a significant uptick in trading activity relative to valuation.
Will BTC Surge Further?
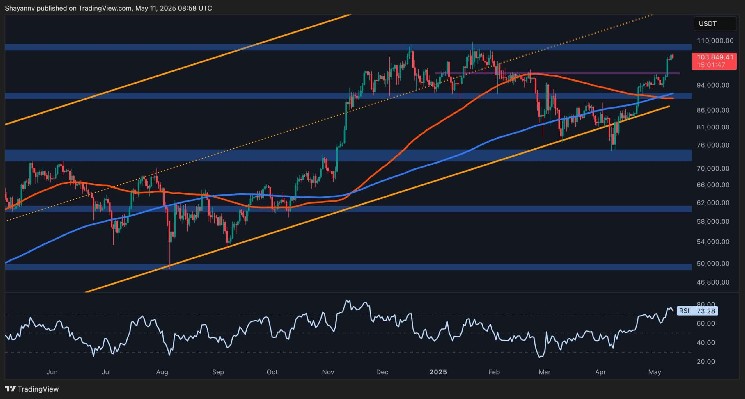
After a brief consolidation phase, Bitcoin’s price action regained bullish momentum. A clear breakout pushed the asset past both the 9-period and 21-period moving averages. These moving averages currently rest at $103,832.21 and $102,847.27 respectively.
The Relative Strength Index (RSI) presently reads 63.84, just beneath the key 70 threshold. Its smoothed average aligns precisely at 70.00, signaling that the rally may have cooled just shy of overbought conditions. If RSI breaks higher again, it could reignite buyer interest. Conversely, a slide below 60 might invite selling pressure.
Support rests near $102,000 where the 21-period moving average converges with previous consolidation. A breakdown under this level may send BTC toward the $100,000 psychological threshold or lower. However, resistance around $105,000 currently caps further gains. If this ceiling is breached, BTC could aim for $107,500 and possibly $110,000.
The Chaikin Money Flow (CMF) reveals a positive bias, indicating continued capital inflows into Bitcoin. Although not extremely elevated, its positioning affirms underlying bullish interest in the asset.
The moving average crossover acts as a crucial technical signal. The upward cross of the short-term average over the long-term reflects growing buyer dominance. Historically, this pattern aligns with intermediate rallies.


Leave a Reply