
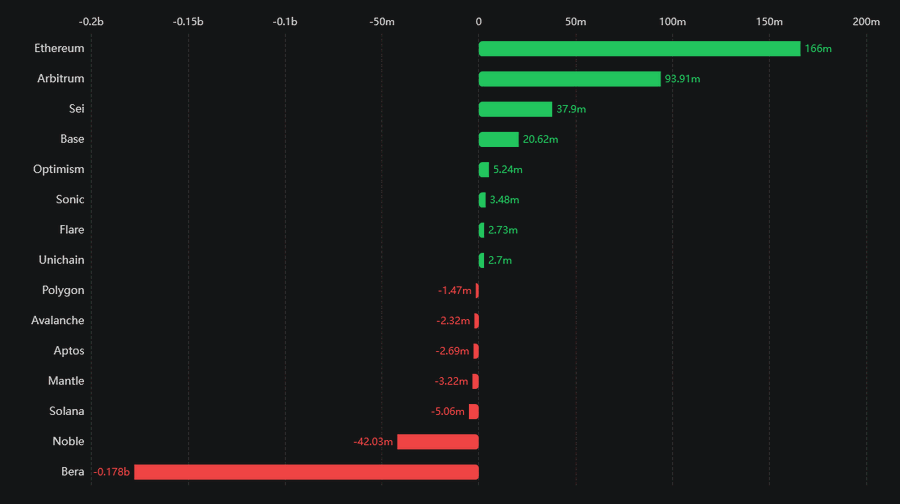
Ethereum has taken the lead in decentralized exchange (DEX) activity, recording the highest net inflows over the past 24 hours. On-chain data shows $166 million in inflows, indicating that traders may be positioning ahead of a possible breakout.
This activity, combined with technical signals and market structure, has drawn the attention of analysts who are watching closely for a move toward $2,500.
Ethereum Tops DEX Inflows as Trader Interest Grows
Ethereum has once again demonstrated its dominance in the DEX ecosystem. According to recent data, it recorded $166 million in net DEX inflows, far ahead of Arbitrum, which came in second with $93.91 million. Other blockchains such as Sei, Base, and Optimism also saw positive flows, though none matched Ethereum’s scale.
Source| X
These flows suggest that traders are accumulating ETH at current levels. Analysts view this activity as a signal of growing confidence.
Meanwhile, some blockchains experienced notable outflows. Bera, in particular, recorded a $170 million withdrawal, which could suggest investors are moving capital away from risk or reallocating to stronger networks like Ethereum.
Ethereum’s consistent leadership in DEX flows may be supported by its deep liquidity, broad developer adoption, and high usage in decentralized applications. These factors continue to attract capital, especially during times of market uncertainty.
RSI Signals a Potential Recovery Phase
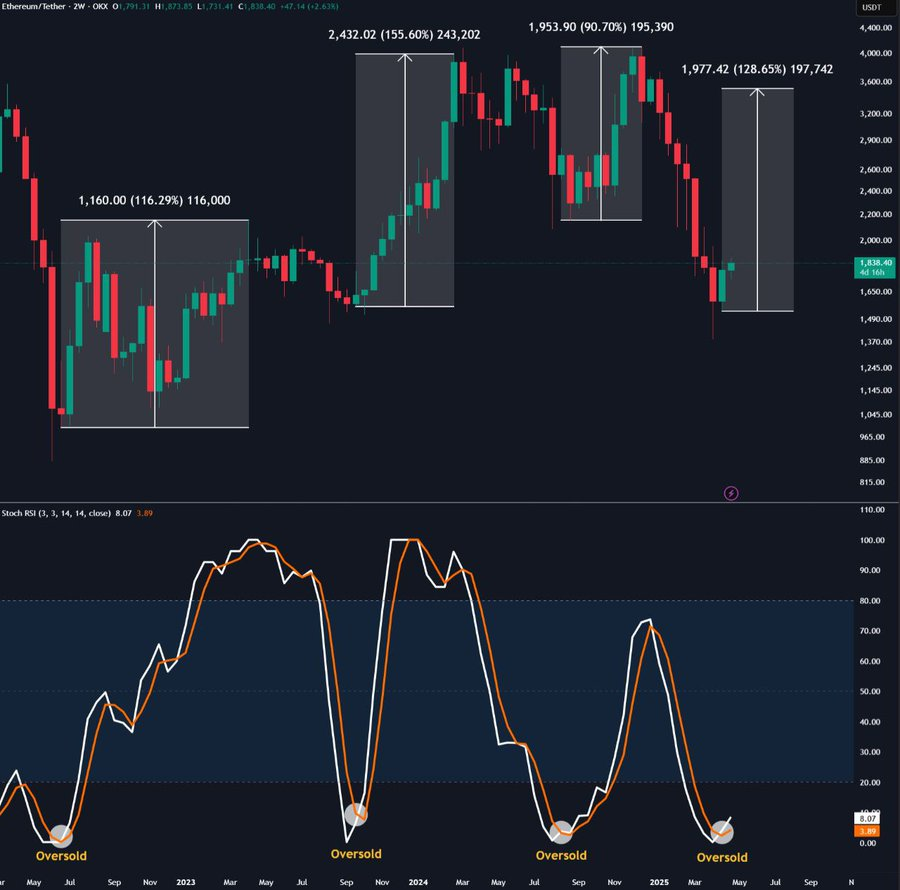
Technical indicators indicate Ethereum sits within an oversold zone because of the Stochastic Relative Strength Index (Stoch RSI).
Change analyst cas_abbe’s assessment indicates the indicator now stands at the same point in the market as it has only three other times within recent market history.
Source| X
The market exhibited rallies starting between 90% and reaching 155% following these previous oversold events, which occurred between three and four months. According to analyst Cas_abbe, Ethereum could exceed $3,400 during July or August 2025.
A momentum indicator is what the Stoch RSI represents in technical analysis. A Stochastic Relative Strength Index (Stoch RSI) crossover underneath the range indicates upcoming market reversals.
Without offering definite price movement, the indicator serves as a widely utilized instrument for traders to anticipate direction shifts. This most recent crossover demonstrates potential bullish momentum increase as market buyers enter, while volume validation demonstrates strong support for upward trends.
Chart Pattern Suggests Breakout Toward $2,500
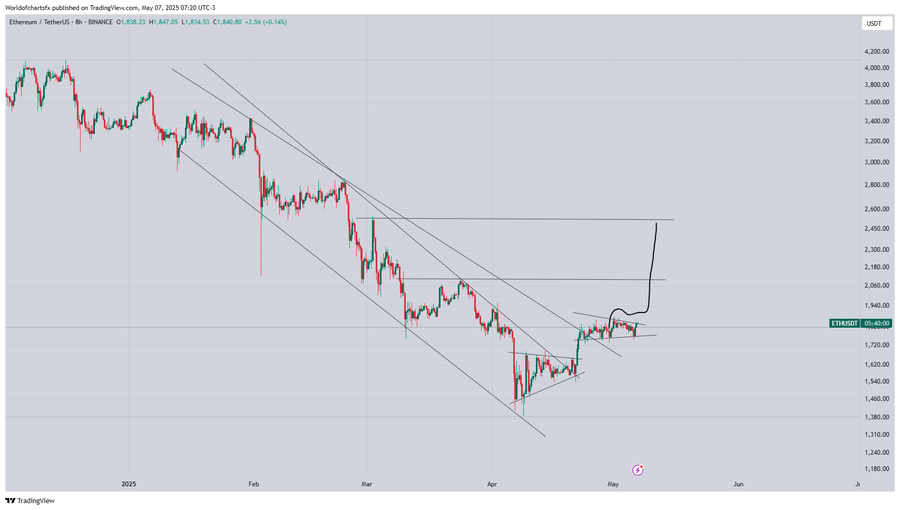
Technical indicators from Ethereum’s 8-hour chart point to an approaching breakout of price levels. According to market analyst WorldOfCharts1, Ethereum successfully exited an ongoing downward channel that formed since January 2025. ETH has built a consolidation pattern near $1,900 after its successful breakout from that level.
Source| X
Technical analysis shows these patterns form when markets experience strong movements followed by steady periods of price stabilization, which initiate the continuation of the current trend. Given an ETH breakout beyond the $1,950-$2,000 resistance area, the analytical chart suggests target prices at $2,180 and $2,500.
Cooling Spot Volume Could Reduce Selling Pressure
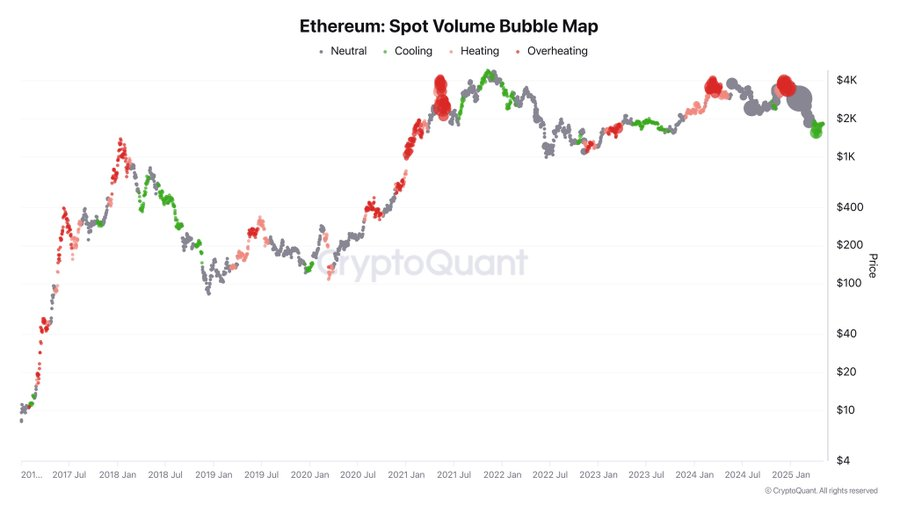
An additional layer of analysis comes from a spot volume bubble map provided by CryptoQuant. The map, analyzed by Darkfost_Coc, shows a cooling trend in Ethereum’s spot volume. The chart uses the size of each bubble to represent trading volume and color to show volume momentum.
Source| X
The current data reveals smaller bubbles with green coloring that indicates both decreasing transaction volume along with slower market trading speeds. During this corrective period the market cooling effects potentially reduce market volatility and prevent forced asset liquidations.
According to Darkfost_Coc spot volume stabilization through cooling volumes shows potential to stabilize the market yet does not serve as evidence for a pricing bottom.
Past market declines indicated falling volume which leads to price stabilization periods. ETH might develop recovery fundamentals under these present conditions.


Leave a Reply