
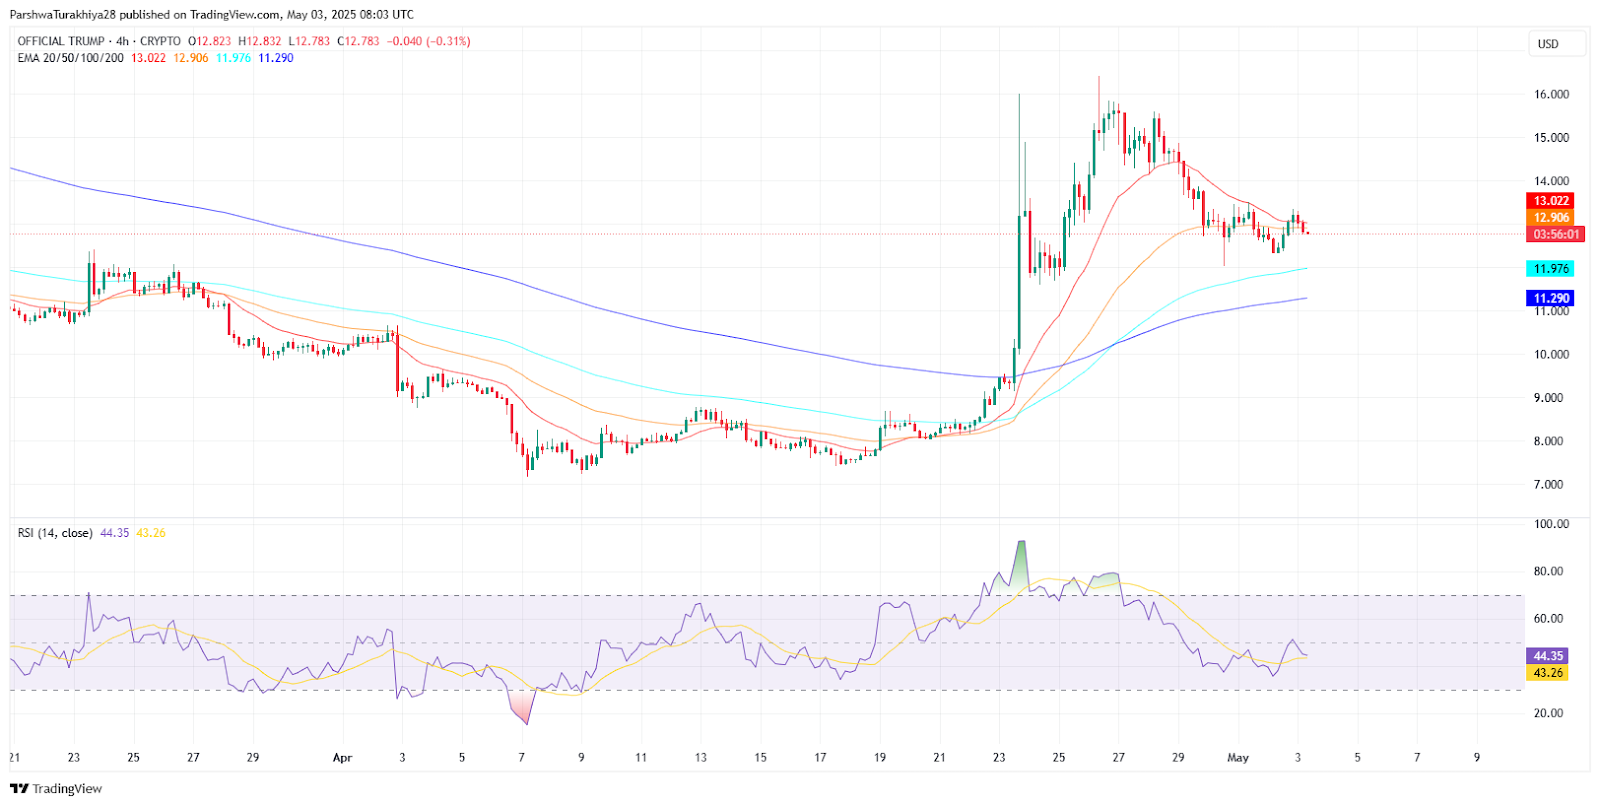
After reaching a high of $16.42 in late April, the $TRUMP token entered a consolidation phase, trading around $12.80 on May 3, 2025. The 4-hour chart displays a symmetrical triangle pattern taking shape, with the lower boundary established near $12.10. This $12.10 area has consistently served as a rebound zone, absorbing selling pressure since the peak.
On the upside, resistance between $13.30 and $13.40 holds firm. This zone aligns with the triangle’s upper ceiling and a horizontal supply area identified by analysts. Fibonacci retracement levels drawn from the April rally pinpoint $13.38 (0.382), $14.22 (0.5), and $14.74 (0.618) as critical benchmarks. Bulls have failed to reclaim the initial $13.38 level, keeping the price structure sideways.
Momentum Indicators Signal Caution for $TRUMP
$TRUMP price dynamics (November 2024 – May 2025)
Technical momentum indicators reflect weakening buyer strength. The Relative Strength Index (RSI) remains suppressed below 45, showing buyers have not regained control since the late April high. The Moving Average Convergence Divergence (MACD) indicator flattened, showing minimal histogram expansion and no clear bullish or bearish divergence.
Related: Fr8Tech Invests $1M in Trump Tokens to Back Trade and Treasury
Also, the Stochastic RSI, after previously reaching overbought territory, now sits in a neutral reading. This reinforces the current lack of directional urgency in $TRUMP’s price action
Volatility Cools as Price Squeezes Between Key Averages
Volatility decreased significantly following the April price surge, confirmed by sharply contracting Bollinger Bands. The price currently drifts between the Bollinger mid-band and the lower band, offering no clear directional bias based on this indicator.
Exponential Moving Averages (EMAs) are also tightening. The 20-period and 50-period EMAs converge around $12.91, forming immediate intraday resistance. The 100-EMA ($11.95) and 200-EMA ($11.27) sit below the price, positioned to act as dynamic support levels if the $12.10 horizontal support breaks.
May Forecast: $TRUMP Range-Bound Unless Breakout Occurs
Viewing the daily chart, $TRUMP holds above a broader uptrend line originating from its late-March base near $7.80. Bulls continue defending the $12.10 support level despite the selloff from the highs. However, a failure to break decisively above $13.40 with supporting volume increases the risk of a secondary dip.
Related: SHIB’s 7% April Gain Minted Millionaires, Breakout Eyed in May
For May 2025, forecasts based on this technical setup show $TRUMP remaining range-bound between $12.10 and $14.22 unless a high-volume breakout above $14.22 or a breakdown below $12.10 materializes. A push above $14.22 opens targets at $15.48 and the previous high near $16.42. Conversely, losing the $12.10 support creates downside risk towards the $11.00–$11.20 zone.
Disclaimer: The information presented in this article is for informational and educational purposes only. The article does not constitute financial advice or advice of any kind. Coin Edition is not responsible for any losses incurred as a result of the utilization of content, products, or services mentioned. Readers are advised to exercise caution before taking any action related to the company.


Leave a Reply