Solana (SOL) is at a critical point after recently breaking above $150 and surpassing a major milestone of 400 billion total transactions.
On-chain activity remains strong, but momentum indicators like RSI and narrowing EMA gaps suggest bullish strength has started to cool. SOL is now trading near an important support level at $145.59, with both downside risks and upside opportunities in play.
Solana Network Surpasses 400 Billion Transactions
Solana just shattered a major milestone, surpassing 400 billion total transactions. The achievement comes during renewed momentum for SOL, with the price recently pushing above $150 for the first time since early March before facing a modest pullback.
On-chain activity remains strong, with decentralized exchange (DEX) volume surging to $21 billion over the last seven days—a 44% increase that keeps Solana firmly at the top of the leaderboard.
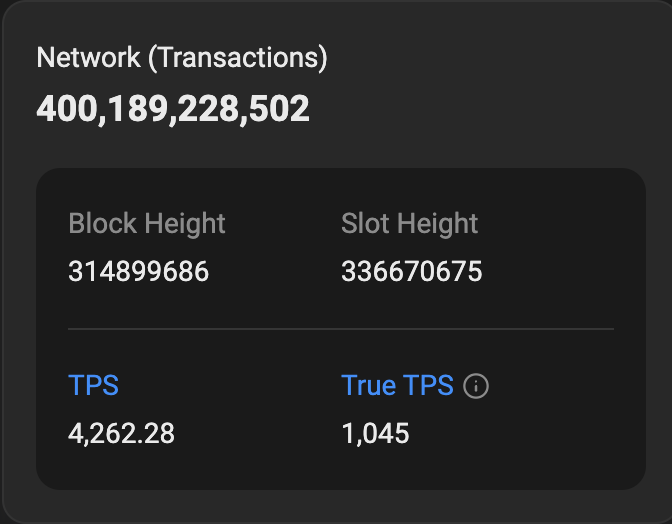
Solana Transactions Data. Source: Solscan.
Since hitting rock bottom at $9.98 on January 1, 2023, SOL has delivered a staggering 1412% rally, standing out as one of the cycle’s top performers.
Solana has also seen an ecosystem explosion in the last year. Pump alone has generated over $75 million in fees over the past month, while heavyweight protocols like Raydium, Meteora, Jupiter, and Jito continue to generate millions in monthly revenue.
Momentum Cools for SOL as RSI Falls Sharply From Recent Highs
Solana’s Relative Strength Index (RSI) has cooled sharply, dropping to 50.61 after hitting 70.52 four days ago.
The fast decline mirrors the slowdown in SOL’s price momentum after its rally above $150, suggesting that bullish strength is losing steam.
The RSI, a widely used momentum indicator, measures how quickly and strongly prices move over a given period. Readings above 70 signal overbought conditions, and below 30 indicate oversold territory. A level around 50 typically reflects a neutral stance, where buying and selling forces are more balanced.
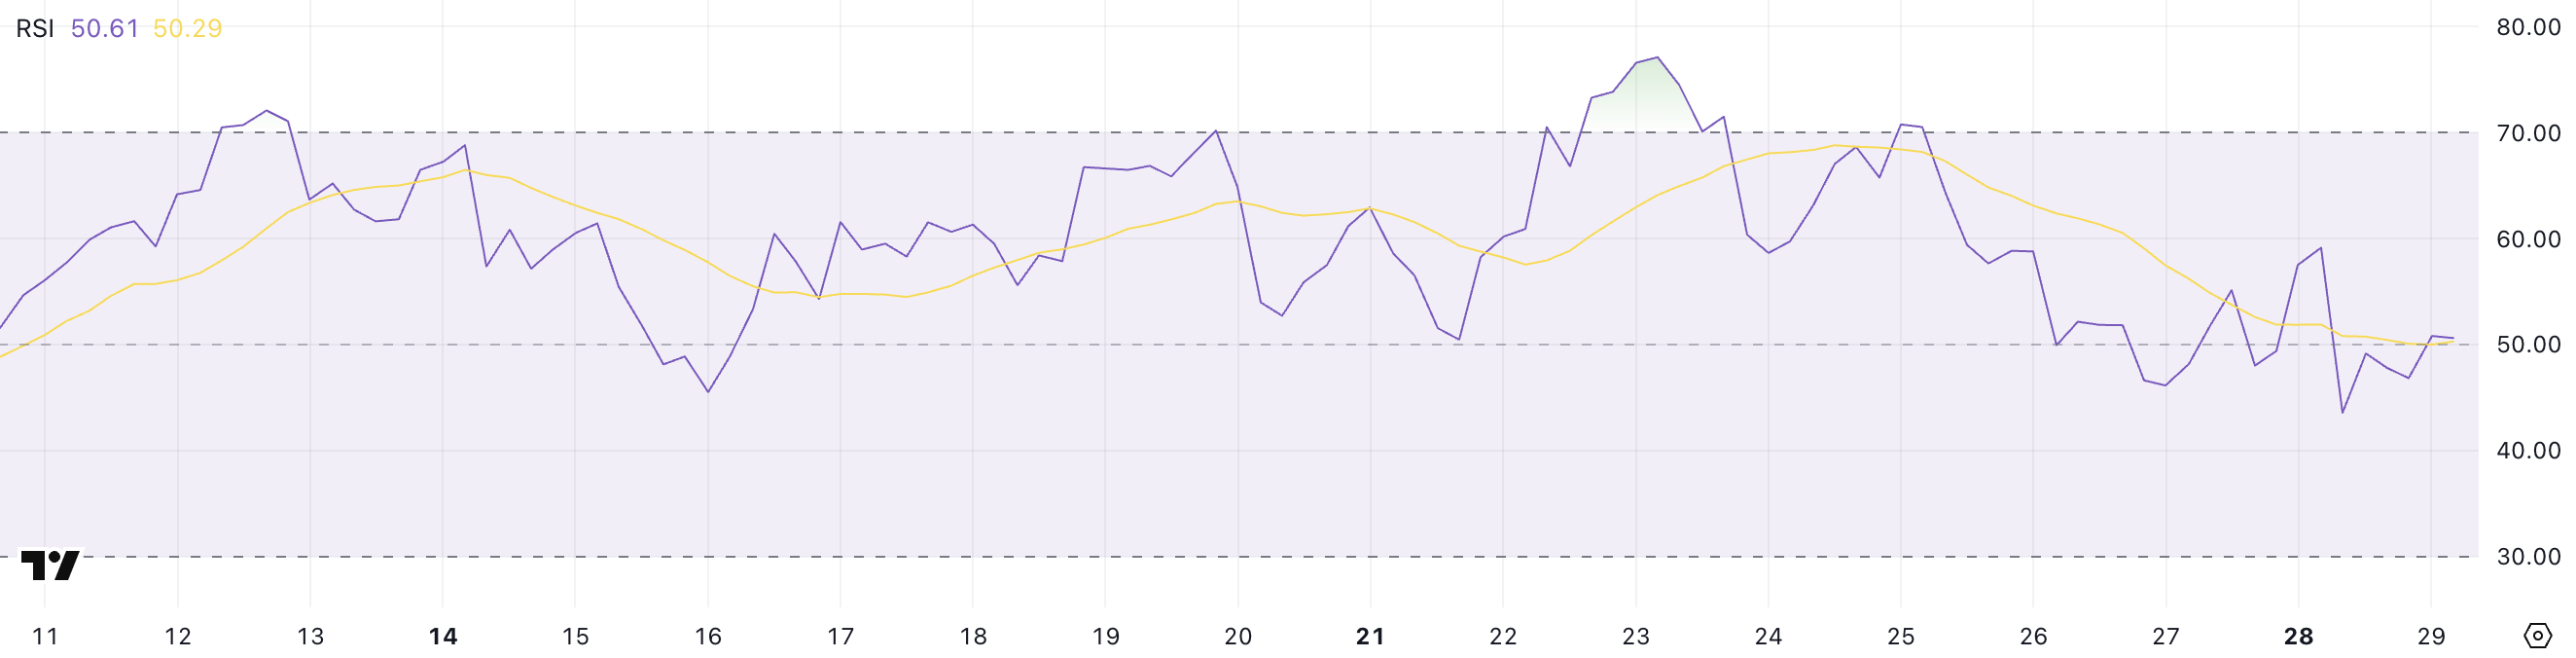
The market is at a key crossroads with Solana’s RSI now hovering near 50.
If bullish pressure picks up again, the RSI could rise back toward overbought levels, paving the way for another leg higher. On the other hand, a continued drift lower could confirm weakening momentum, opening the door for a broader price correction.
SOL’s momentum has clearly cooled for now, and traders are watching closely for the next decisive move.
SOL’s Bullish Setup Faces Test: Support or Breakout Ahead?
Solana’s EMA lines still signal a bullish setup, with short-term averages above long-term ones. However, the gap between them has narrowed compared to a few days ago, reflecting a loss of momentum.
Solana price is currently hovering near a key support level at $145.59—an area traders are watching closely.
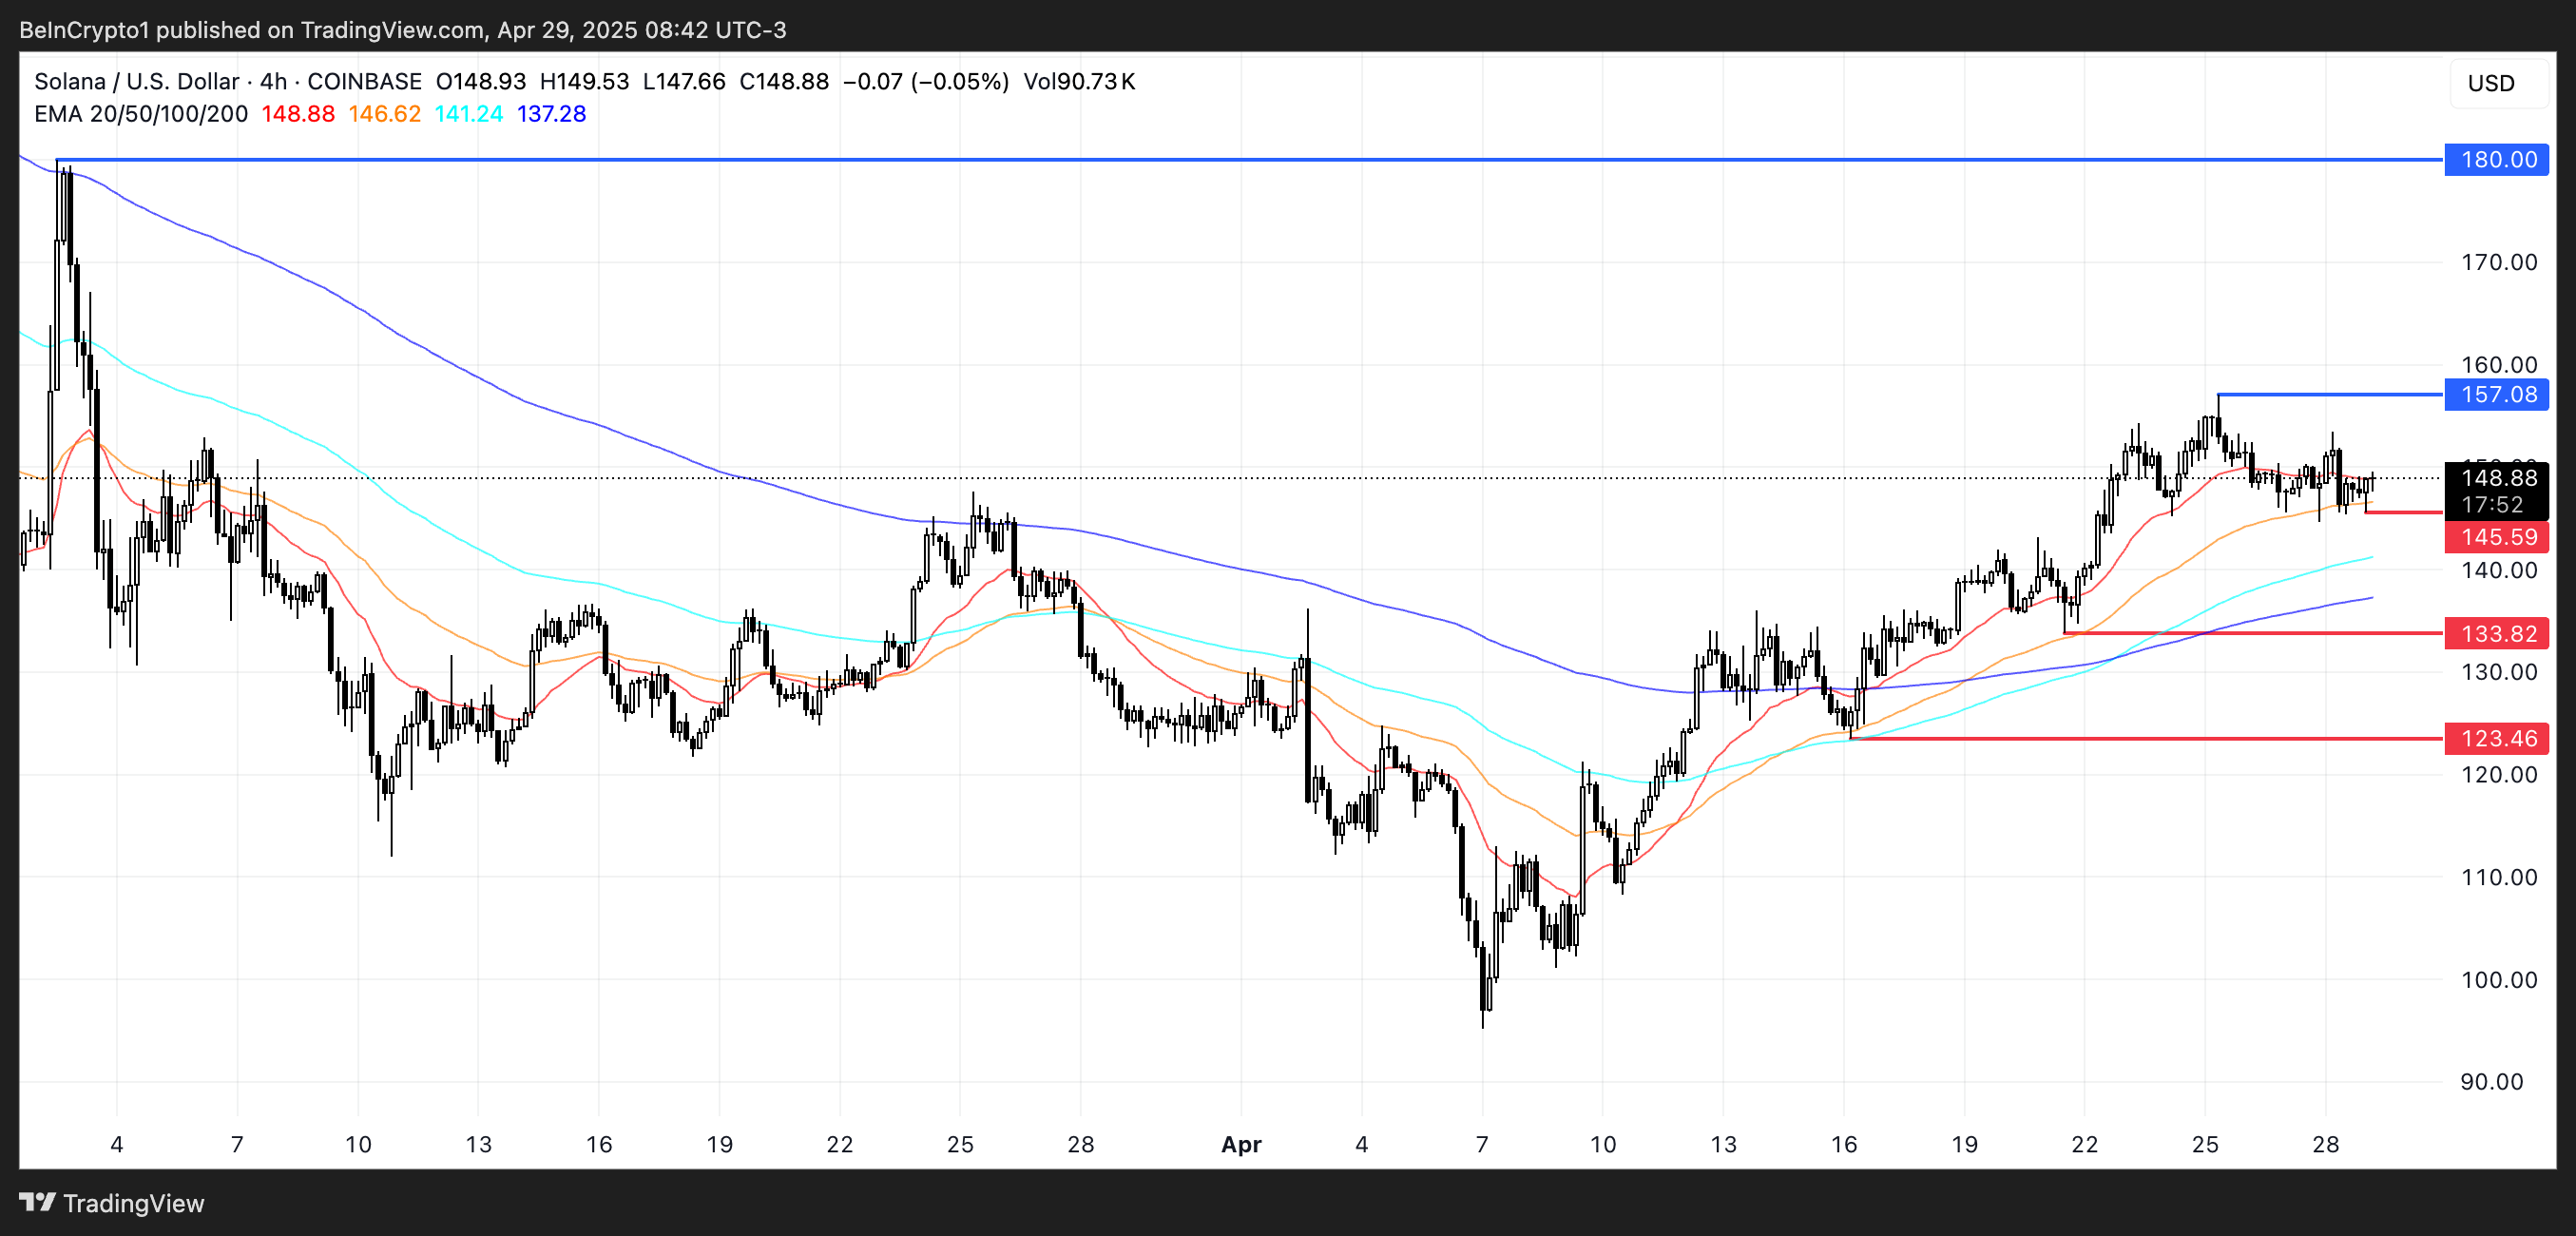
If this support breaks, the price could slip toward $133.82, and if selling pressure intensifies, a deeper move to $123.46 could be in play.
Conversely, if buyers regain the momentum seen earlier this month, Solana could bounce and retest resistance around $157.
A clear breakout above that zone would likely trigger a push toward $180, reviving the bullish trend.


Leave a Reply